FTT I think this currency can make such a move in the future, of course, keep in mind that ftt currency accumulates a lot of whales and also has a good fund for growth.
FTTUSDT trade ideas

Realistic FTT analysis, possible scenariosDisclaimer
This technical analysis by no means, is a financial advice and this only works for me and I would like to share it with you, Please do you own research.
FTX Token is one of the tokens whales started to accumulate as it can be seen on etherscan. Hence, this is a reason I am doing this analysis to mention scenarios and entry/exit points for this token.
If the price bounce back from $37 area of support, it will make double bottom which is a bullish pattern . It will be a good place to entry point (but don't forget to use Dollar-Cost Average technique in both buying and selling to minimize the risk). However, price can fall till $22 range and still stays bullish . It would be logical to buy at $30 as it can possibly supports mental and price action support for FTT , before price reaches $22 support range. ( Bullish scenario, which what I expect personally).
RSI+ and LMACD are currently have a positive momentum but trend is still negative in our indicators. They would provide more information as time passes to either approve or deny bullish trend .
The main resistance for Bullish scenarios are:
$43 range . Have to pass this area of resistance to complete the successful double bottom .
$50 range . Major mental, Fibonacci, Volume profile , Price action and both 100 and 200 MA resistance. ( Major Exit point)
$57 range , Fibonacci, Price action and Volume profile resistance. The point of control of our volume profile is in this area. Can consider as one of exit points.
$73 range and $85 ( ATH ) which our price action resistance. If it passes ATH the next major resistance is $100 which personally think it is unlikely it short term.
In bearish scenario, if support level of $22 range won't support the FTT , Price can even fall around $15 and $10 as next major resistance.

Great buy opportunity for FTX TokenThis ascending channel worked well at FTX token price, and the price is approaching the channel's support. Also, we have a hidden divergence on RSI that could help the price trend change to bullish.

FTTUSDT (200% GAIN IN 2022)FTT LONG TERM CHART SHOWING THAT IT WILL HIT $116. Buy the dip till $33 and hold it


FTT HTF uptrend - new ATH possible ?I was looking at FTT chart from HTF perspective and I could not unsee the similarities I saw in the beginning of the uptrend. We can clearly see HHs and HLs which confirm the uptrend but if you watch the double retest of trendline with EMA 12/21 crossing up - it started a huge move upwards to the new ATH. All I am saying is that it is looking like the trend line is gonna get double retested again and EMA 12/21 is on the verge of crossing up. I am gonna be closely watching FTT and if the 2nd retest of trend line holds (could be also wick to range low - $35), there is only one destination - somewhere up - possibly new ATH.
From LTF perspective, FTT is tradable within range $35 - $61 - buy low, sell high (take profit around mid range already imo :) )

FTTUSDT Daily Plotting Fibs Retracement Exercise
Wick down to 78.60% area and since then trading above 78.60% area
Head & Shoulder play out followed by a Descending Parallel Channel.
Breakout from the descending parallel channel & retest.

FTTUSDT Technical Analysis💎 FTTUSDT has broken above the descending channel. It has also has been making HHS and HLs in the channel. After the pullback we can expect that the price goes higher.
💵 Invest Only 5% of your Portfolio
🎳 Entry now or from 43.27 - 40.84
☕️ TP1 46.67
🍺 TP2 51.21
🍻 TP3 55.63
🍾 TP4 60.00
🍷 TP5
🍸 TP6
🍹 TP7
🎁 TP8
🚫 SL 40.49 - 38.99
Good Luck 🎲
Check the Links in Description and if you LIKE this analysis, please support our page and Ideas by hitting the LIKE 👍 button. ❤️ Your Support is really appreciated! ❤️
Traders, if you have your own opinion about it, please write your own in the comment box. We will be glad for this.
Feel free to request any pair/instrument analysis or ask any questions in the comment section below.
We will have more FREE forecasts in TradingView soon
Have a profitable day 😊👍🏻


FTT, FTXFTX in Heikin Ashi looks like a bottom formation underway with a bullish divergence that has been confirmed.

FTT breakout 🚀..40 to 50% potentialFTT breakout 🚀..40 to 50% potential , good luck 😉📈....stoploss important ....because of some week market situations 💯....but now its bullish 🔥😎

FTT good to shortThe price consolidated below the resistance zone and began to roll back to it, but did not break through, I expect a decline below

Buy FTTUSDTIF the price close 1D under 36 that's may lead the price to drop to 26.26 ,,,
SL : 21
TP1 : 35
TP2 : 45
TP3 : 55

FTT, PROBALBE SCENARIO...Stay tuned for more updates of FTT. Market doesn't feel well now. Look at the safe entry point, please.


FTTUSDT (ftx’s native token)ANALYSIS 📈📉💹Market Cap:$5,574,433,827
Volume24h: $107,005,774 -13.49%
Circulating Supply: 139,132,501.02 FTT 40% ❗🚫
Max Supply :352,170,015
💰Holders Statistics:
Top 10 Holders: 89.8%
Top 20 Holders:95.38%
Top 50 Holders:98.44%
Top 100 Holders:99.16% ❗🚫
📈📉 technical :
As you can see on the weekly timeframe for the pair of FTT / usdt , Since June 2019 it has listed in ftx exchange and it has had a continues increase in this assumed upward channel ,but I figured that out the correlation between btc and ftt price action has been so high til now, so its future movements high probably depend to btc scenarios and choices again. thus if it want get started a new bullish rally and maintain this channel we should see at least a weekly close on the red downward trend line or on resistance red zone for assurance , otherwise I think it will probably start the bearish scenario, by breaking down its upward channel ,and it'll decrease to the lower support area .
🛑current weeky resistance level: $51-57
❇️current weeky support level: $30-34
--------------------------------------------------------------------------------------------------------------------
👉This analysis is my personal opinion ,not a financial advice ,so do your own research.
💜 if you're a fan of my analyses PLZ follow me ,give a big thumbs 👍 and drop comment 🗯💭
🙏with Best Regards


FTT Mid TermThis will be my plan for FTT play till the end of year or maybe early 2022. Calculations made on fibo and meaningless trendlines :)
Fingers crossed.
Peace.


Gartley Harmonic patterns Harmonic patterns always excite me
Everything is specified in the image
Beautifully placed targets

FTT uptrend lineFTT / USDT
FTX TOKEN try to find some support here around the uptrend line
As long as price hold support priority is bullish
Keep your eye on it


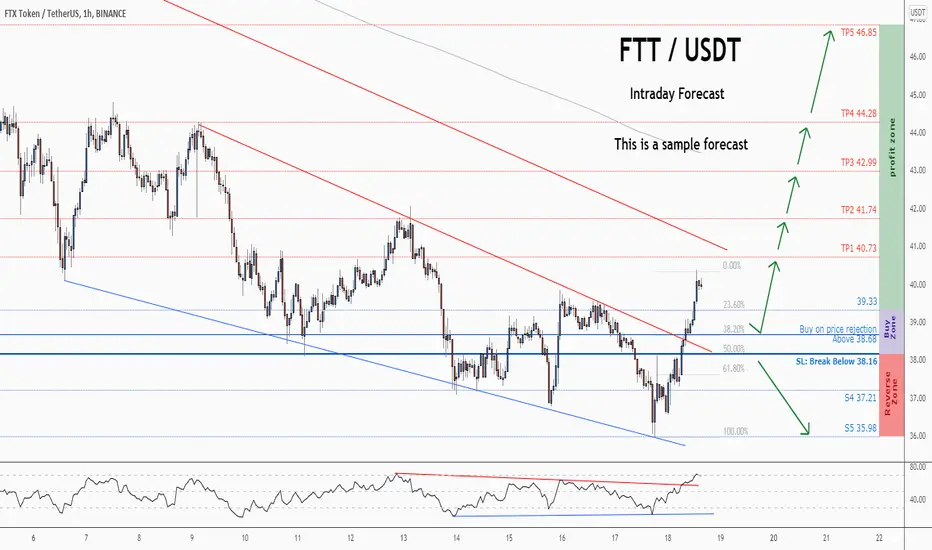
💡Don't miss the great buy opportunity in FTTUSD @FTX_OfficialTrading suggestion:
". There is a possibility of temporary retracement to the suggested support line (38.68).
. if so, traders can set orders based on Price Action and expect to reach short-term targets."
Technical analysis:
. FTTUSD is in a range bound, and the beginning of an uptrend is expected.
. The price is below the 21-Day WEMA, which acts as a dynamic resistance.
. The RSI is at 68.
Take Profits:
TP1= @ 40 .73
TP2= @ 41.74
TP3= @ 42.99
TP4= @ 44.28
TP5= @ 46.85
SL= Break below S2
❤️ If you find this helpful and want more FREE forecasts in TradingView
. . . . . Please show your support back,
. . . . . . . . Hit the 👍 LIKE button,
. . . . . . . . . . Drop some feedback below in the comment!
❤️ Your support is very much 🙏 appreciated!❤️
💎 Want us to help you become a better Forex / Crypto trader?
Now, It's your turn!
Be sure to leave a comment; let us know how you see this opportunity and forecast.
Trade well, ❤️
ForecastCity English Support Team ❤️