Nikkei 225 Wave Analysis – 27 May 2025
- Nikkei 225 reversed from support level 36675,00
- Likely to rise to resistance level 38800,00
Nikkei 225 index recently reversed up from the pivotal support level 36675,00 (which formed the daily Japanese candlesticks reversal pattern Morning Star at the start of May).
The support level 36675,00 strengthened by the 20-day moving average and by the 38.21% Fibonacci correction of the previous upward impulse from April.
Nikkei 225 index can be expected to rise to the next resistance level 38800,00, top of the previous minor correction 2.
JPN225 trade ideas

Nikkei H4 | Falling toward a multi-swing-low supportNikkei (JPN225) is falling towards a multi-swing-low support and could potentially bounce off this level to climb higher.
Buy entry is at 36,688.39 which is a multi-swing-low support that aligns with the 23.6% Fibonacci retracement.
Stop loss is at 35,300.00 which is a level that lies underneath an overlap support and the 38.2% Fibonacci retracement.
Take profit is at 38,831.79 which is a swing-high resistance.
High Risk Investment Warning
Trading Forex/CFDs on margin carries a high level of risk and may not be suitable for all investors. Leverage can work against you.
Stratos Markets Limited (tradu.com ):
CFDs are complex instruments and come with a high risk of losing money rapidly due to leverage. 63% of retail investor accounts lose money when trading CFDs with this provider. You should consider whether you understand how CFDs work and whether you can afford to take the high risk of losing your money.
Stratos Europe Ltd (tradu.com ):
CFDs are complex instruments and come with a high risk of losing money rapidly due to leverage. 63% of retail investor accounts lose money when trading CFDs with this provider. You should consider whether you understand how CFDs work and whether you can afford to take the high risk of losing your money.
Stratos Global LLC (tradu.com ):
Losses can exceed deposits.
Please be advised that the information presented on TradingView is provided to Tradu (‘Company’, ‘we’) by a third-party provider (‘TFA Global Pte Ltd’). Please be reminded that you are solely responsible for the trading decisions on your account. There is a very high degree of risk involved in trading. Any information and/or content is intended entirely for research, educational and informational purposes only and does not constitute investment or consultation advice or investment strategy. The information is not tailored to the investment needs of any specific person and therefore does not involve a consideration of any of the investment objectives, financial situation or needs of any viewer that may receive it. Kindly also note that past performance is not a reliable indicator of future results. Actual results may differ materially from those anticipated in forward-looking or past performance statements. We assume no liability as to the accuracy or completeness of any of the information and/or content provided herein and the Company cannot be held responsible for any omission, mistake nor for any loss or damage including without limitation to any loss of profit which may arise from reliance on any information supplied by TFA Global Pte Ltd.
The speaker(s) is neither an employee, agent nor representative of Tradu and is therefore acting independently. The opinions given are their own, constitute general market commentary, and do not constitute the opinion or advice of Tradu or any form of personal or investment advice. Tradu neither endorses nor guarantees offerings of third-party speakers, nor is Tradu responsible for the content, veracity or opinions of third-party speakers, presenters or participants.

Japanese Shark Pattern Spotted!Based on the harmonic shark pattern & 0.88 Fibonacci level,
there's a Chance of a Dive from 37.8k towards Deeper targets.
📉 Stay tuned for updates!

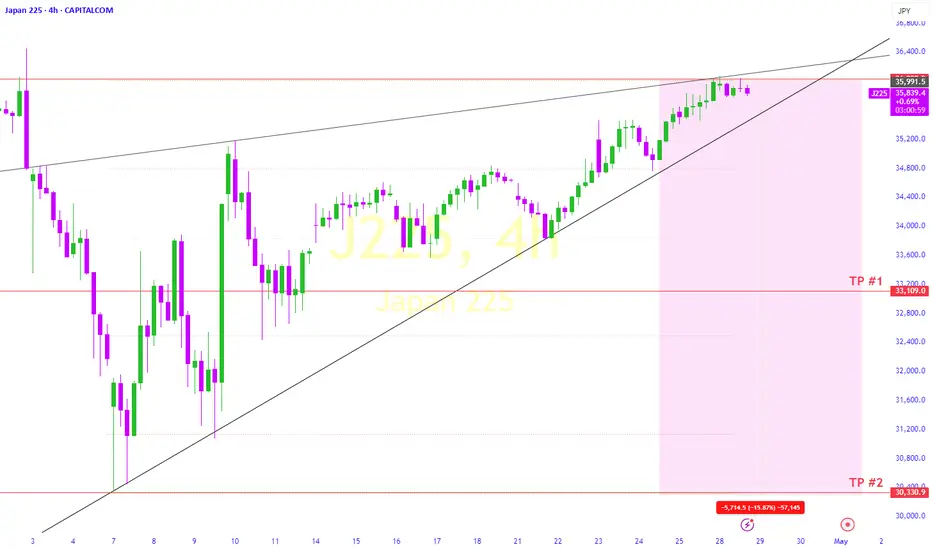
"JP225 / NIKKEI" Index CFD Market Heist Plan (Swing/Day Trade)🌟Hi! Hola! Ola! Bonjour! Hallo! Marhaba!🌟
Dear Money Makers & Robbers, 🤑 💰💸✈️
Based on 🔥Thief Trading style technical and fundamental analysis🔥, here is our master plan to heist the "JP225 / NIKKEI" Index CFD Market. Please adhere to the strategy I've outlined in the chart, which emphasizes long entry. Our aim is to escape near the high-risk ATR Zone. Risky level, overbought market, consolidation, trend reversal, trap at the level where traders and bearish robbers are stronger. 🏆💸"Take profit and treat yourself, traders. You deserve it!💪🏆🎉
Entry 📈 : "The heist is on! Wait for the MA breakout (37300) then make your move - Bullish profits await!"
however I advise to Place Buy stop orders above the Moving average (or) Place buy limit orders within a 15 or 30 minute timeframe most recent or swing, low or high level for Pullback entries.
📌I strongly advise you to set an "alert (Alarm)" on your chart so you can see when the breakout entry occurs.
Stop Loss 🛑: "🔊 Yo, listen up! 🗣️ If you're lookin' to get in on a buy stop order, don't even think about settin' that stop loss till after the breakout 🚀. You feel me? Now, if you're smart, you'll place that stop loss where I told you to 📍, but if you're a rebel, you can put it wherever you like 🤪 - just don't say I didn't warn you ⚠️. You're playin' with fire 🔥, and it's your risk, not mine 👊."
📍 Thief SL placed at the recent/swing low level Using the 4H timeframe (35600) Day trade basis.
📍 SL is based on your risk of the trade, lot size and how many multiple orders you have to take.
🏴☠️Target 🎯: 39300 (or) Escape Before the Target
🧲Scalpers, take note 👀 : only scalp on the Long side. If you have a lot of money, you can go straight away; if not, you can join swing traders and carry out the robbery plan. Use trailing SL to safeguard your money 💰.
💰💵💴💸"JP225 / NIKKEI" Index CFD Market Heist Plan (Day / Swing Trade) is currently experiencing a bullishness🐂.., driven by several key factors.👆👆👆
📰🗞️Get & Read the Fundamental, Macro economics, COT Report, Geopolitical and News Analysis, Sentimental Outlook, Intermarket Analysis, Index-Specific Analysis,Positioning and future trend targets with Overall Score...... go ahead to check👉👉👉🔗🔗🌎🌏🗺
⚠️Trading Alert : News Releases and Position Management 📰 🗞️ 🚫🚏
As a reminder, news releases can have a significant impact on market prices and volatility. To minimize potential losses and protect your running positions,
we recommend the following:
Avoid taking new trades during news releases
Use trailing stop-loss orders to protect your running positions and lock in profits
💖Supporting our robbery plan 💥Hit the Boost Button💥 will enable us to effortlessly make and steal money 💰💵. Boost the strength of our robbery team. Every day in this market make money with ease by using the Thief Trading Style.🏆💪🤝❤️🎉🚀
I'll see you soon with another heist plan, so stay tuned 🤑🐱👤🤗🤩

NI225: Target Is Down! Short!
My dear friends,
Today we will analyse NI225 together☺️
The recent price action suggests a shift in mid-term momentum. A break below the current local range around 37,160.17 will confirm the new direction downwards with the target being the next key level of 36,963.23 and a reconvened placement of a stop-loss beyond the range.
❤️Sending you lots of Love and Hugs❤️

Inverted Head and Shoulders on the JP225 (NIKKEI)I am so sleepy and this idea kept me up before going to bed, like a lullaby that will give you sweet dreams.
Look at this beautiful Inverted head and shoulders on JP225, what does this mean for the XXXJPY pairs?
Does this mean weakness for the Japanese Yuan?
The first target for this inverted head and shoulders is 43000 and... and... there is a very beautiful Zig-Zag on the right shoulder.

Today On Japan 225 Miss Entry So Today on Japan 225 was almost miss the entry but the P&L wasn't too bad. Leave a comment on your thought. Real Trad Real ACCOUNT. This is not a financial advice. Trading is risky

JP225 19.05.2025~+ JP GDP Miss
~+ Moody's downgrade
~+ BOJ's cautious stance amid tariff uncertainties
+ COT
+ Seasonals

NI225 (Japan 225 Index) – Elliott Wave Update | May 20, 2025The long-term structure of the Nikkei 225 appears to be unfolding in a textbook 5-wave impulsive pattern within a rising channel, consistent with Elliott Wave Theory.
🌀 Wave Structure Breakdown:
🔹 Wave (1): The initial impulsive move from the 2020 COVID lows, marking a clear shift in trend and sentiment.
🔹 Wave (2): A corrective retracement that respected channel support, forming a likely Zigzag or Flat correction, setting the base for Wave (3).
🔹 Wave (3): An extended, powerful rally that reflects strong investor confidence and fundamental recovery. This wave has the steepest angle and highest momentum, as expected.
🔹 Wave (4): A complex corrective phase, likely a running Flat or Triangle, which has held above key structural support at 30,611.57. The lower bound of the channel remained intact.
🔹 Wave (5): Currently in early development. Based on Fibonacci extensions:
1.382 target lies at 46,814.91
1.618 target at 49,563.74
Full extension (Wave 5 = Wave 1) points toward a potential top near 54,013.12
These targets align closely with the upper trendline of the rising channel, suggesting a confluence zone for a possible long-term top.
🔍 Technical Confluence:
The EMA ribbon continues to act as dynamic support and resistance.
Price has bounced strongly from the (4) low, confirming bullish momentum resumption.
42,365.53 may act as a key pivot before continuation toward the 1.382–1.618 extension cluster.
📈 Outlook:
As long as the structure remains within the defined channel and above 30,611.57, the bullish scenario toward 46–49k remains intact. Caution near the projected Fibonacci extensions is warranted for potential exhaustion of Wave (5).
💬 Let me know your thoughts — are we headed toward a generational top in the Nikkei, or will macro headwinds cap the upside?

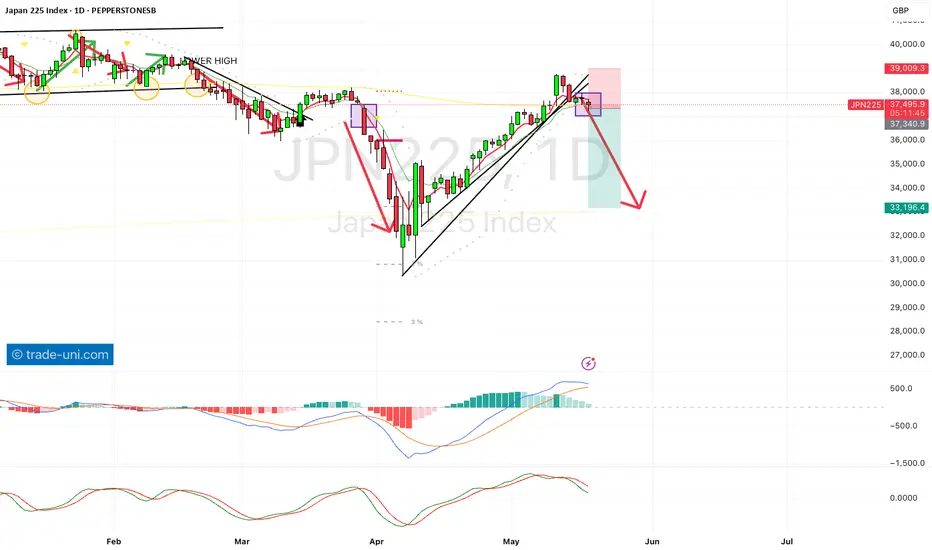
Trade-Uni - SELL NIKKEI We have sold this index based on the daily timeframe at 37493 level, looking for 33000 are over the next 3 months.
NI225: Bulls Are Winning! Long!
My dear friends,
Today we will analyse NI225 together☺️
The recent price action suggests a shift in mid-term momentum. A break above the current local range around 37,753.72 will confirm the new direction upwards with the target being the next key level of 37,983.91 and a reconvened placement of a stop-loss beyond the range.
❤️Sending you lots of Love and Hugs❤️

Are you shorting the bounce or waiting for confirmation?Japan’s Q1 GDP came in worse than expected: -0.2% QoQ (-0.7% annualized). Weak consumption, soft exports, and a fading external boost despite a weak yen isn't a great combo for Asia’s largest export economy.
The Nikkei 225 reacted immediately, and the H4 chart is starting to reflect deeper structural pressure.
🔍 Technical Outlook:
- Price reversed from the high of 38,745.
- Price is testing the 50 SMA and could enter the Ichimoku cloud.
- The cloud is signalling a twist, which could be a sign of momentum fading and the trend weakening or reversing.
📊 Projection:
If the price closes below the 50 SMA and breaks through the cloud, further downside could be expected, with the target levels at
- 36,800 (last consolidation zone), and
- 35,570 (38.2% fibonacci retracement level and 200 SMA).
Alternatively, if the bulls defend the cloud, we could see the price climb to the resistance level of 40,500
This is a classic macro meets technicals moment. A weak data print is lining up against the possibility of a technical rollover.

UPDATE - Japan Index is now set for upside to 45,172The last analysis, was working like a charm until Trump had to pause the tariffs, and go back on everything he said bit by bit.
So, the analysis has now turned from bearish to bullish - and as traders we adjust our sails accordingly.
There are a few other reasons for the rally to come.
📈 Positive U.S.-China Trade Developments Boost Market Confidence
Recent progress in U.S.-China trade talks has alleviated investor concerns, leading to a 0.4% rise in the Nikkei 225, reflecting renewed optimism in the Japanese stock market.
💰 Significant Foreign Investment Inflows Strengthen the Market
In April 2025, foreign investors injected 3.68 trillion yen into Japanese equities, marking the largest monthly inflow in two years, driven by confidence in Japan's corporate reforms and stable economic outlook.
Reuters
📊 Analysts Forecast Record Highs by End of 2025
A Reuters poll predicts the Nikkei 225 will reach an all-time high of 42,500 by the end of 2025, driven by attractive valuations, corporate reforms, and supportive monetary policies.
So this goes in line with this technical analysis - even though they are completely independent analysis.
Reverse Cup and Handle
Price>20 and 200MA
Target 45,172
Disclosure: I am part of Trade Nation's Influencer program and receive a monthly fee for using their TradingView charts in my analysis.

NI225 CORRECTION AHEAD|SHORT|
✅NIKKEI has been growing recently
And the index seems locally overbought
So as the pair is approaching a horizontal resistance of 38,216
Price decline is to be expected
SHORT🔥
✅Like and subscribe to never miss a new idea!✅
Disclosure: I am part of Trade Nation's Influencer program and receive a monthly fee for using their TradingView charts in my analysis.

NI225: Absolute Price Collapse Ahead! Short!
My dear friends,
Today we will analyse NI225 together☺️
The recent price action suggests a shift in mid-term momentum. A break below the current local range around 37,503.33 will confirm the new direction downwards with the target being the next key level of 37,094.95 and a reconvened placement of a stop-loss beyond the range.
❤️Sending you lots of Love and Hugs❤️

Nikkei 225 index Wave Analysis – 8 May 2025
- Nikkei 225 index broke the resistance zone
- Likely to rise to resistance level 38275,00
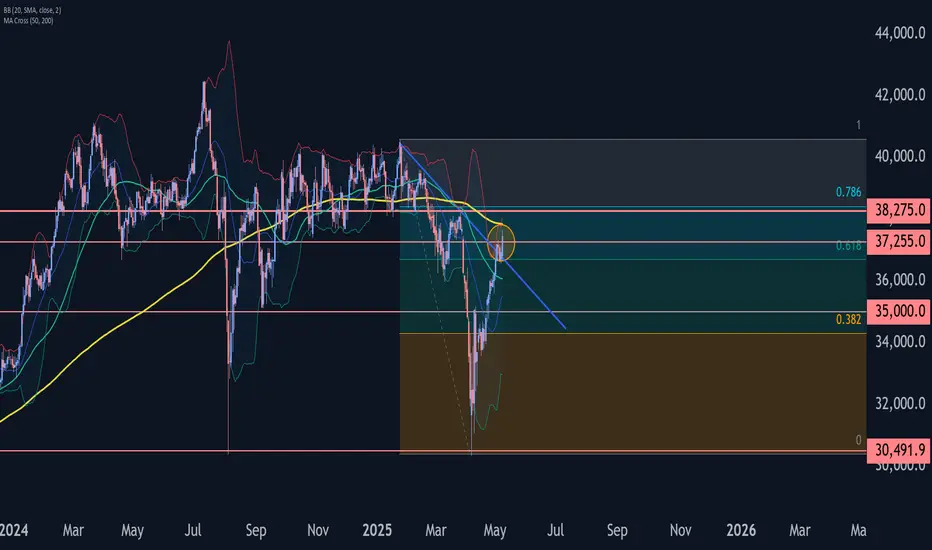
Nikkei 225 index recently broke the resistance area between the resistance level 37255.00, resistance trendline from January and the 61,8% Fibonacci correction of the downward impulse from January.
The breakout of this resistance zone accelerated the active impulse wave c of the intermediate ABC correction 4 from the start of April.
Nikkei 225 index can be expected to rise to the next resistance level 38275,00 (former monthly high from March and the target for the completion of the active impulse wave c).
BOJ vs Fed: Fueling a Japan 225 Recovery?After an aggressive selloff that pushed Japan 225 (Nikkei) into oversold territory, the index printed a solid bullish reaction off the 30,500 key zone. This area aligns with prior demand and offers a clean invalidation level for long positioning. With heavy bearish sentiment already priced in, I’m positioning long with TP near the premium zone around 40,000.
The fundamental picture may be stormy, but technically, this is a textbook reversal play, I’m ready to ride it.
Technicals:
• Price reacted from major support around 30,500–30,800 zone, a level that held in the past.
• Daily imbalance filled, creating the perfect spot for a potential rebound.
• Descending channel break on lower timeframes indicates early bullish structure shift.
• Target zone: 39,000–40,000.
• SL: Below recent swing low, respecting tight risk management.
Fundamentals:
• Global Risk-Off Sentiment: Recession fears and tariffs pushed risk assets lower — Nikkei included.
• Tariff-Driven USD Weakness: US tariffs created uncertainty and drove global equity selloffs. However, hopes for a US-Japan trade deal are increasing, favoring the JPY and supporting Japanese equities.
• BOJ-Fed Divergence: BoJ is expected to raise rates due to broadening inflation, while the Fed is seen cutting rates soon. This differential supports capital inflows into Japan.
• Flight to Safety: Japan’s stable economy and improving policy outlook make it attractive as global volatility increases.
The selloff may have been excessive due to panic over macro headlines. However, price structure tells its own story, and it’s hinting at a bullish reversal. With multiple technical and fundamental confluences lining up, this is a well-balanced long opportunity with clear risk parameters.
Note: Please remember to adjust this trade idea according to your individual trading conditions, including position size, broker-specific price variations, and any relevant external factors. Every trader’s situation is unique, so it’s crucial to tailor your approach to your own risk tolerance and market environment.

Formation of the Wedge Pattern in the Japanese Index.The formation of a wedge pattern in the Japanese stock index has raised concerns among investors, as it often signals potential volatility and market correction.
A wedge pattern typically occurs when the price movement narrows between converging trend lines, indicating indecision among traders.
In the context of the Japanese stock market, this pattern can be particularly telling, as it suggests that the index may be reaching a critical juncture. Recent trends have shown a gradual decline in the index, which could lead to a significant downturn if the wedge breaks downward.
Investors should remain vigilant, as a sustained drop in the index could trigger broader market reactions and impact investor sentiment. Monitoring key economic indicators and geopolitical developments will be essential in navigating this precarious phase. As the situation unfolds, prudent risk management strategies will be vital for those looking to mitigate potential losses in a fluctuating market environment.
NI225: Strong Bearish Sentiment! Short!
My dear friends,
Today we will analyse NI225 together☺️
The market is at an inflection zone and price has now reached an area around 36,830.69 where previous reversals or breakouts have occurred.And a price reaction that we are seeing on multiple timeframes here could signal the next move down so we can enter on confirmation, and target the next key level of 36,249.62..Stop-loss is recommended beyond the inflection zone.
❤️Sending you lots of Love and Hugs❤️


NI225: Strong Bearish Sentiment! Short!
My dear friends,
Today we will analyse NI225 together☺️
The in-trend continuation seems likely as the current long-term trend appears to be strong, and price is holding below a key level of 35,720.94 So a bearish continuation seems plausible, targeting the next low. We should enter on confirmation, and place a stop-loss beyond the recent swing level.
❤️Sending you lots of Love and Hugs❤️

Super Sell idea!Hello guys. as you see market reaches to a super great zone and it is time to collapse. more than 15 percent. isn't it great? do u agree? and why? comment me! (wink)

Nikkei 225 Wave Analysis – 23 April 2025
- Nikkei 225 broke the resistance area
- Likely to rise to resistance level 36355.00
Nikkei 225 index recently broke the resistance area between the pivotal resistance level 35000.00 (which stopped the previous correction 2, former strong support from September) and the 61.8% Fibonacci correction of the downward impulse from March.
The breakout of this resistance area would extend the earlier short-term ABC correction 2 from the start of April.
Nikkei 225 index can be expected to rise toward the next resistance level 36355.00 (former support which stopped the previous corrections iii and v last month).
