Fading JD.com?JD.com
Short Term
We look to Sell at 67.06 (stop at 69.54)
Previous support, now becomes resistance at 66.00. The move higher is mixed and volatile, common in corrective sequences. The bias is still for lower levels and we look for any gains to be limited. Further downside is expected although we prefer to sell into rallies close to the 66.00 level.
Our profit targets will be 54.87 and 47.50
Resistance: 66.00 / 76.00 / 90.00
Support: 54.00 / 49.00 / 35.00
Disclaimer – Saxo Bank Group. Please be reminded – you alone are responsible for your trading – both gains and losses. There is a very high degree of risk involved in trading. The technical analysis, like any and all indicators, strategies, columns, articles and other features accessible on/though this site (including those from Signal Centre) are for informational purposes only and should not be construed as investment advice by you. Such technical analysis are believed to be obtained from sources believed to be reliable, but not warrant their respective completeness or accuracy, or warrant any results from the use of the information. Your use of the technical analysis, as would also your use of any and all mentioned indicators, strategies, columns, articles and all other features, is entirely at your own risk and it is your sole responsibility to evaluate the accuracy, completeness and usefulness (including suitability) of the information. You should assess the risk of any trade with your financial adviser and make your own independent decision(s) regarding any tradable products which may be the subject matter of the technical analysis or any of the said indicators, strategies, columns, articles and all other features.
Please also be reminded that if despite the above, any of the said technical analysis (or any of the said indicators, strategies, columns, articles and other features accessible on/through this site) is found to be advisory or a recommendation; and not merely informational in nature, the same is in any event provided with the intention of being for general circulation and availability only. As such it is not intended to and does not form part of any offer or recommendation directed at you specifically, or have any regard to the investment objectives, financial situation or needs of yourself or any other specific person. Before committing to a trade or investment therefore, please seek advice from a financial or other professional adviser regarding the suitability of the product for you and (where available) read the relevant product offer/description documents, including the risk disclosures. If you do not wish to seek such financial advice, please still exercise your mind and consider carefully whether the product is suitable for you because you alone remain responsible for your trading – both gains and losses.
013A trade ideas

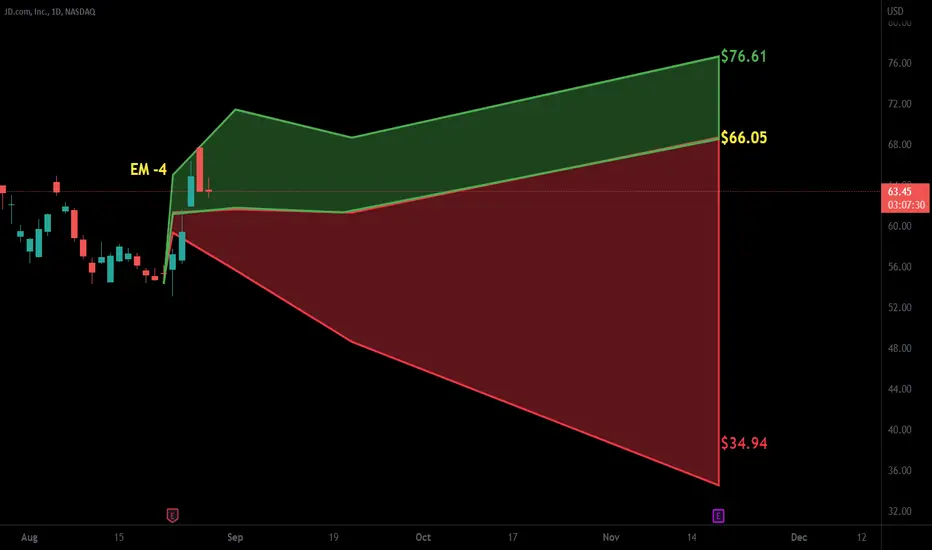
$JD with a Bullish outlook following its earnings #Stocks The PEAD projected a Bullish outlook for $JD after a Positive Under reaction following its earnings release placing the stock in drift A.
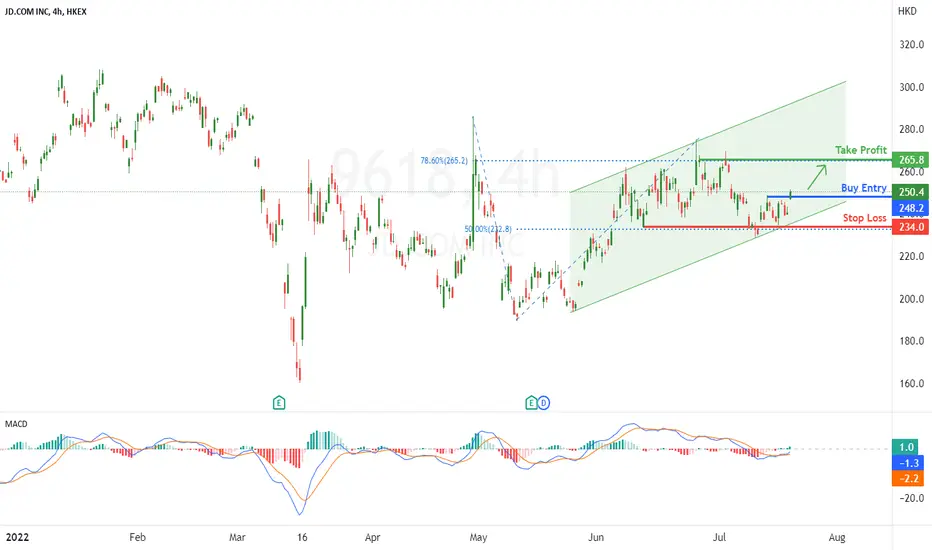
JD.COM Potential Bullish ContinuationOn the H4, with price moving within the ascending trend channel and MACD showing a bullish momentum. we have a bullish bias that price will rise from the entry at 248.2 to the take profit at 265.8 at the swing high in line with the 78.6% fibonacci retracement. Alternatively, price may drop from the entry to the stop loss at 234.0 at the multiple swing low in line with the 50% fibonacci retracement.
Any opinions, news, research, analyses, prices, other information, or links to third-party sites contained on this website are provided on an "as-is" basis, as general market commentary, and do not constitute investment advice. The market commentary has not been prepared in accordance with legal requirements designed to promote the independence of investment research, and it is therefore not subject to any prohibition on dealing ahead of dissemination. Although this commentary is not produced by an independent source, FXCM takes all sufficient steps to eliminate or prevent any conflicts of interest arising out of the production and dissemination of this communication. The employees of FXCM commit to acting in the clients' best interests and represent their views without misleading, deceiving, or otherwise impairing the clients' ability to make informed investment decisions. For more information about the FXCM's internal organizational and administrative arrangements for the prevention of conflicts, please refer to the Firms' Managing Conflicts Policy. Please ensure that you read and understand our Full Disclaimer and Liability provision concerning the foregoing Information, which can be accessed on the website.
JD ShortBounce back to weekly resistance, around 66,
Trendline break + retest
Earning: 8/17/2022 Est. 0.40
Short 62.4
Stop 65
Target 55, 50
Risk management is much more important than a good entry point.
I am not a PRO trader.
In my trading plan, the Max Risk of each short term trade should be less than 1% of an account.

JD.com heading lower? JD.com
Short Term - We look to Sell at 65.66 (stop at 69.54)
Previous support, now becomes resistance at 65.00. The 200 day moving average should provide resistance at 68.32. The bias is still for lower levels and we look for any gains to be limited. Further downside is expected although we prefer to sell into rallies close to the 65.66 level.
Our profit targets will be 57.21 and 41.10
Resistance: 65.50 / 76.00 / 90.00
Support: 55.60 / 49.00 / 35.00
Disclaimer – Saxo Bank Group. Please be reminded – you alone are responsible for your trading – both gains and losses. There is a very high degree of risk involved in trading. The technical analysis, like any and all indicators, strategies, columns, articles and other features accessible on/though this site (including those from Signal Centre) are for informational purposes only and should not be construed as investment advice by you. Such technical analysis are believed to be obtained from sources believed to be reliable, but not warrant their respective completeness or accuracy, or warrant any results from the use of the information. Your use of the technical analysis, as would also your use of any and all mentioned indicators, strategies, columns, articles and all other features, is entirely at your own risk and it is your sole responsibility to evaluate the accuracy, completeness and usefulness (including suitability) of the information. You should assess the risk of any trade with your financial adviser and make your own independent decision(s) regarding any tradable products which may be the subject matter of the technical analysis or any of the said indicators, strategies, columns, articles and all other features.
Please also be reminded that if despite the above, any of the said technical analysis (or any of the said indicators, strategies, columns, articles and other features accessible on/through this site) is found to be advisory or a recommendation; and not merely informational in nature, the same is in any event provided with the intention of being for general circulation and availability only. As such it is not intended to and does not form part of any offer or recommendation directed at you specifically, or have any regard to the investment objectives, financial situation or needs of yourself or any other specific person. Before committing to a trade or investment therefore, please seek advice from a financial or other professional adviser regarding the suitability of the product for you and (where available) read the relevant product offer/description documents, including the risk disclosures. If you do not wish to seek such financial advice, please still exercise your mind and consider carefully whether the product is suitable for you because you alone remain responsible for your trading – both gains and losses.

JD High-risk Initial LongJD High-risk Initial Long. SL and TP on the chart. 10-20x leverage. Move SL on TP.

JD.com USA Sun Storm Investment Trading Desk & NexGen Wealth Management Service Present's: SSITD & NexGen Portfolio of the Week Series
Focus: Worldwide
By Sun Storm Investment Research & NexGen Wealth Management Service
A Profit & Solutions Strategy & Research
Trading | Investment | Stocks | ETF | Mutual Funds | Crypto | Bonds | Options | Dividend | Futures |
USA | Canada | UK | Germany | France | Italy | Rest of Europe | Mexico | India
Disclaimer: Sun Storm Investment and NexGen are not registered financial advisors, so please do your own research before trading & investing anything. This is information is for only research purposes not for actual trading & investing decision.
#debadipb #profitsolutions

JD potentially going for a new high after S/R flip.JD is coming off a correction from its all time high after reporting negative net incomes again, dropping in price along other Chinese stocks. JD has mostly been netting a loss recently due to re-investments into smaller companies part of JD, such as their delivery service DADA, but also others like JD Logistics. Their revenue seems to still be in an uptrend. I believe once profit margins get sorted out with time, they will start netting a profit again and EPS will go up > leading to increases in stock price.
This confidence is seen by JD as well from their first dividend payment that came out recently, which was a pretty substantial size, almost $2b dollars. About $1.26 per ADS.
“We are pleased to announce this return of capital to shareholders,” said Richard Qiangdong Liu, chairman of the Board of JD.com. “Our Board’s approval of the special dividend reflects our confidence in the Company’s long-term growth potential and strong balance sheet, which allow us to pay the dividend to shareholders, while maintaining financial and operational flexibility to continue to grow our business over the long term. In the long run, we will also consider measures including paying dividends as appropriate from time to time to give back to our shareholders.”
A recent headline: 'Market Chatter: JD.com Wins China Nod to Buy Three Cargo Planes'
As JD keeps expanding I can only see a better future for this company.
To me current prices seem like a great discount moment to buy.


#SuakuFlowsWatchlist - 5/19/22#SuakuFlowsWatchlist
$JD P < 50.64
Focusing more on the quality of picks instead of quantity. Will also be looking at $SPX on the side.
Other tickers I reviewed that didn't make the WL - $LLY, $MRK, $ABT, $SHOP and $AMD.
Scale out above 20%.


$JD with a Bullish outlook following its earnings #Stocks The PEAD projected a Bullish outlook for $JD after a Positive over reaction following its earnings release placing the stock in drift B with an expected accuracy of 50%.


5/11/22 JDJD.com, Inc. ( NASDAQ:JD )
Sector: Retail Trade (Internet Retail)
Market Capitalization: $88.170B
Current Price: $51.65
Breakdown price: $50.30
Sell Zone (Top/Bottom Range): $64.35-$57.45
Price Target: $44.00-$42.80
Estimated Duration to Target: 67-70d
Contract of Interest: $JD 9/16/22 50p
Trade price as of publish date: $7.22/contract

#SuakuFlowsWatchlist - 5/11/22#SuakuFlowsWatchlist
$JD P < 50.18
$QCOM P < 134.63
$UBER P < 22.80
$UAL P < 43.08
Looking to play the downside only. Some of these are pricey so size accordingly
Other tickers I reviewed that didn't make the WL - $AMD, $PBR, $VTRS, $MU, $EBAY and $PG.
Scale out above 20%.

waiting for a clear breakout past resistanceJD still below strong resistance even after it saw end of week rally recently, watching for break past 69.48 and i may enter long position, break below 56.62 for short position


JD OverviewThe buy zone I'm looking at are in between $50 - $48.
Next possible resistance to close position would be around $60 - $62 (Mid BB/Fibo in H4) perhaps even up to $64.
Daily show a different overview currently the Mid BB/Fibo located around $68 - $70.
Any solid closed candle below $48 would mean that this idea is invalid.
**This is just my personal idea and do trade at your own risk. Goodluck.
**JD is a very volatile stock so be wary and trade carefully.

$JD $2.70 gap down China Stocks Are Very Bearish , As Us / China relations strained over many issues tensions leading toward increased negativity = escalation into a red market.
Also earnings are 5/11/22 Leave Your Thoughts, Thanks.


The Great Loss MysteryWe define a huge deficit as an unnecessary variation in judgment. The deviation is the average, common probability, and the great deficit is the variation of these errors.
Huge losses are a universal problem and should be of concern to anyone making professional judgments.
Tips:
Investment variation, tears please note!

$JD with a Bearish outlook following its earnings #Stocks The PEAD projected a Bearish outlook for $JD after a Negative Under reaction following its earnings release placing the stock in drift D with an expected accuracy of 100%.

JD: China Rebound Over? JD.com - Short Term - We look to Sell at 64.14 (stop at 70.67)
Previous support, now becomes resistance at 62.00. 50 1day EMA is at 67.80. The bias is still for lower levels and we look for any gains to be limited. We look for losses to be extended today.
Our profit targets will be 46.03 and 41.10
Resistance: 65.00 / 80.00 / 90.00
Support: 50.00 / 41.00 / 35.00
Disclaimer – Saxo Bank Group. Please be reminded – you alone are responsible for your trading – both gains and losses. There is a very high degree of risk involved in trading. The technical analysis, like any and all indicators, strategies, columns, articles and other features accessible on/though this site (including those from Signal Centre) are for informational purposes only and should not be construed as investment advice by you. Such technical analysis are believed to be obtained from sources believed to be reliable, but not warrant their respective completeness or accuracy, or warrant any results from the use of the information. Your use of the technical analysis, as would also your use of any and all mentioned indicators, strategies, columns, articles and all other features, is entirely at your own risk and it is your sole responsibility to evaluate the accuracy, completeness and usefulness (including suitability) of the information. You should assess the risk of any trade with your financial adviser and make your own independent decision(s) regarding any tradable products which may be the subject matter of the technical analysis or any of the said indicators, strategies, columns, articles and all other features.
Please also be reminded that if despite the above, any of the said technical analysis (or any of the said indicators, strategies, columns, articles and other features accessible on/through this site) is found to be advisory or a recommendation; and not merely informational in nature, the same is in any event provided with the intention of being for general circulation and availability only. As such it is not intended to and does not form part of any offer or recommendation directed at you specifically, or have any regard to the investment objectives, financial situation or needs of yourself or any other specific person. Before committing to a trade or investment therefore, please seek advice from a financial or other professional adviser regarding the suitability of the product for you and (where available) read the relevant product offer/description documents, including the risk disclosures. If you do not wish to seek such financial advice, please still exercise your mind and consider carefully whether the product is suitable for you because you alone remain responsible for your trading – both gains and losses.
