Dell Technologies Inc - Symmetrical Triangle - Buy OpportunityA symmetrical triangle was formed.
In a symmetrical triangle, the breakout direction usually follows the trend, in this is case it is an upward breakout. However, there's a high possibility that it breaks downward. Therefore, wait for the breakout to happen before trading the breakout. Alternatively, we can trade within the symmetrical triangle
Trading Strategy:
Option 1: Trade when the candle closes outside of the triangle.
Break upwards: Take profit at 200
Break downwards: Take profit at 40
Stop loss position: 6% from breakout price
Option 2:
Trade inside the symmetrical triangle, when the price hits the lower trend line.
Place a buy position with take profit when the price hits the upper trend line.
Stop loss position: 6% from the upper or lower trend line.
12DA trade ideas

DELL: Expecting Strong Forecasts for 2025Key arguments supporting the idea
Attractive Multiples and Technical Outlook
Growth Across All Business Segments
Dell Rapidly Expanding Market Share in AI Server Segment
Dell Technologies develops, manufactures, and sells a wide range of integrated solutions, products, and services. The company operates through two segments: Infrastructure Solutions Group (ISG) and Client Solutions Group (CSG). The ISG segment provides solutions for customers’ digital transformation, including artificial intelligence (AI), machine learning, data analytics, as well as modern and traditional data storage. The CSG segment offers branded personal computers, including laptops, desktops, workstations, and peripherals such as monitors, keyboards, and webcams.
Investment Thesis
Positive Technical Outlook and Low Multiples. After releasing financial results for Q3 FY2025, Dell’s stock entered a correction phase, reaching three-month lows. However, the stock subsequently resumed an upward trajectory. Currently, the RSI technical indicator remains below the overbought zone, signaling further upside potential. Dell’s market multiples appear highly attractive. The forward P/E ratio of 14 is slightly above the company’s historical levels but remains significantly lower than the sector average (24) and the S&P 500 index (23). The forward P/S ratio of 0.8 is considerably below the sector average (3.28), reinforcing the view that Dell is currently undervalued.
2025 Expected to Mark the Start of a New PC Upgrade Cycle. Following the COVID-19-driven surge in PC sales, many of these devices are reaching the end of their typical 3-4 year lifecycle. Despite initial analyst expectations for significant market growth, real growth in 2024 was just 1% YoY. According to updated IDC forecasts, 2025 is expected to be the year of PC market recovery. Key growth drivers include: massive device aging from previous years’ purchases, end of support for Windows 10 in October 2025 and increased demand for AI-integrated computers IDC projects 4.3% PC market growth in 2025, which should positively impact Dell’s largest segment – CSG.
AI Infrastructure to be the Strongest Growth Driver for ISG. Dell maintains a leading position in data center supply, alongside HP and SMCI, making it a key player in AI training infrastructure. For the first nine months of FY2025, Dell’s revenue from servers and networking equipment (part of ISG) grew 60% YoY. According to Bloomberg’s consensus, ISG revenue is expected to grow by 30% YoY in FY2025 and by another 15% in FY2026. This growth is driven by rising demand for AI servers, fueled by NVIDIA GB200 chip shipments and U.S. government AI support programs. An additional growth factor could be the shift of market share from SMCI to Dell due to suspicions of SMCI violating U.S. sanctions, which erodes customer trust and encourages migration to a more stable partner.
We maintain a Buy rating on DELL stock with a price target of $135. A stop-loss order is recommended at $90.

DELL eyes on $96.33: Major fib to hold for a Higher-LowDELL is trying to paint a bottom after marketwide dip.
Nice bounce on strong zone and broke this Major fib.
Now retest the fib at $96.32 that bulls must hold now.
===============================================
.

Bullish swing on DELL?🔉Sound on!🔉
📣Make sure to watch fullscreen!📣
Thank you as always for watching my videos. I hope that you learned something very educational! Please feel free to like, share, and comment on this post. Remember only risk what you are willing to lose. Trading is very risky but it can change your life!

Dell Stock Under Pressure as AI Costs Weigh on MarginsShares of Dell Technologies (NYSE:DELL) slipped in premarket trading following the company’s latest earnings report, which signaled potential margin compression in its fiscal 2026 outlook. The decline comes despite robust AI server growth projections, highlighting a complex landscape of opportunities and challenges for the tech giant.
Margin Compression and Tariff Uncertainty Weigh on Sentiment
Dell's financial outlook raised investor concerns as the company forecasted a 100 basis-point decline in adjusted gross margins for fiscal year 2026. This pressure stems largely from rising costs associated with AI server expansion and soft PC demand, which continues to be a headwind.
AI Growth Provides a Silver Lining
Despite the margin headwinds, Dell remains a major player in the AI infrastructure space, forecasting an impressive 53% year-over-year surge in AI server shipments to $15 billion.
Earnings Beat But Revenue Miss
For the fourth quarter, Dell reported:
- Adjusted EPS of $2.68, exceeding estimates of $2.53 per share.
- Revenue of $23.93 billion, slightly below the expected $24.56 billion.
- Forecasted Q1 adjusted EPS of $1.65, below analyst estimates of $1.83.
- Projected revenue between $22.5 billion and $23.5 billion, missing expectations of $23.72 billion.
- Full-year 2026 adjusted EPS expected to be $9.30**, slightly above consensus at $9.29.
Technical Outlook
NYSE:DELL stock closed down 6.26% in Thursday’s session and extended losses in Friday’s premarket trading, currently down 2.23%. The Relative Strength Index (RSI) sits at 41.16, reflecting a weak technical setup.
If the post-earnings sentiment worsens, Dell’s 1-month low could serve as a critical support pivot. Conversely, a break above the 38.2% Fibonacci retracement level could signal a bullish reversal, paving the way for a potential rebound.

Todays Best Performer - DellNYSE:DELL
Scanning through the market today I found some good looking price action in the tech sector. Dell Computers along SMCI ,TSLA, and PLTR where also some big movers today. I look for what price action is the most clean for entry and exit points. Yes, other stocks may have returned more than Dell Computers today. However according to this chart, some great opportunities presented themselves.
NVDA, AMD, and others began to stall out coming into lunch. Out of my surprise DELL had some decent areas of high volume leading into the lunch hour. On the initial pullback after 10AM price setup beautifully at the 0.382 Fibonacci level. At Approximately 11:30 Dell gave you a confirmed breakout move back above the KMA and RSI.
Price Quickly closed above the 0.618 measurement of the most recent pull back indicating strong momentum to upside.
Price Topped out at the 3.00 Fib level from the initial morning pullback, closing the day just near by. A beautiful opportunity to add to a winning position also occurred after a secondary pullback, holding the moving average. Its all in the Fibs. Let the market show you what it wants to do!
Key Points
Use the Fibonacci levels on the Retrace
Scan Heat-maps for Volatility changes
Price will show you good opportunities to trade
Only trade whats best and fits your strategy
Paper trade your ideas, practice finding setups, than perfect them!

Contemplating a Pivot on Dell. DELLPivots, like fades are inherently more risky, but they must always be in the gameplay of any serious trader. They can be potentially very rewarding when they do eventuate and pose lost opportunity if ignored. We generally like at least five factors from five different perspectives to consider a position. Let's see how many this one has.
1. Momentum divergence (not the only one) on Jurik RSX
2. Volatility divergence on VZO plus offset
3. Cross of upper end of MIDAS envelope. Midas formula is based heavily on volumes.
4. Cross of both VZO and Ehlers Stochastic/RSI. This is not the vanilla Stochastic RSI calculation, after Ehlers rethought the indicator.
5. vWAP is now a support, but price action is not over extended beyond one sigma range.
There are more factors that can be put on the list, but this is not a competition - just a simple take on a stock. Manage your risk -trading is not gambling.

LONG DELL @ $100Easy buy, easy R/R, get out at the low.
Inverse head and shoulder.
I like to long something that has been separated from the current market in a way.

$delllike what I see in NYSE:DELL , positiv divigens in the rsi 9, and bull flag, the fib lvls match perfect with the highs

Major Price Movement Incoming for DELLSignalist has detected a precise pattern in NYSE:DELL trading activity, signaling that a substantial price movement is imminent. This isn’t a random fluctuation—it’s a carefully analyzed precursor to a significant market event.
📅 What to Expect:
⌛ Timeline: Anticipate a major move within the next 1 to 4 upcoming 3-hour candles.
📈 Monitor the Charts: Keep an eye on DELL’s price action over the next few candles.
Prepare Your Strategy: Whether you’re bullish or bearish, have your trading plan ready to capitalize on the move.

1/14/25 - $dell - no-brainer sub $110 in '251/14/25 :: VROCKSTAR :: NYSE:DELL
no-brainer sub $110 in '25
- 6% fcf yield (quality) growing HSD - that's all u need to know
- 8x EBITDA for 10% EBITDA growth
- sell off b/c semis/ related Q's, not fundamental
- with SMCI being exposed, dell is the A+ name in this space
- this is the "staple" of tech if you will, v defensive but will participate on beta upside on tech this year
- path to $150 by year-end with some bumps along the road, but we're seeing a bump today that all else equal that looks good enough for me to spend a lil cash and play the reversion, not wed to it, but seems like a high quality trade
enjoy.
V

$dellwe can see that dell have support here, and negativ divigens that i like, i will try to go long, stop lost aruond 5% and uppside 20-30%

Major Price Movement Incoming for DELL!Signalist has detected a precise pattern in NYSE:DELL trading activity, signaling that a substantial price movement is imminent. This isn’t a random fluctuation—it’s a carefully analyzed precursor to a significant market event.
📅 What to Expect:
⌛ Timeline: Anticipate a major move within the next 1 to 4 upcoming 3-hour candles.
📈 Monitor the Charts: Keep an eye on DELL’s price action over the next few candles.
Prepare Your Strategy: Whether you’re bullish or bearish, have your trading plan ready to capitalize on the move.

Dell May Be StumblingDell Technologies has been staggering since the summer, and now some traders may worry about prices trending lower.
The first pattern on today’s chart is the bearish gap on November 27 after guidance came up short. The computer maker held roughly $125 for several sessions, fell and then retested that zone last week before stalling. The resulting lower high may suggest new resistance has been established.
Second, the weakness occurred at the 200-simple moving average (SMA). DELL had tried to hold that line since August. Is it now breaking?
Next, the 50-day SMA is nearing a potential “death cross” below the 200-day SMA. The 8-day exponential moving average (EMA) is additionally below the 21-day EMA. Those patterns are potentially consistent with long- and short-term weakening.
Fourth, stochastics are dipping from an overbought condition.
Finally, the higher lows since December 20 could be viewed as a bearish flag that’s now resolving to the downside.
TradeStation has, for decades, advanced the trading industry, providing access to stocks, options and futures. If you're born to trade, we could be for you. See our Overview for more.
Past performance, whether actual or indicated by historical tests of strategies, is no guarantee of future performance or success. There is a possibility that you may sustain a loss equal to or greater than your entire investment regardless of which asset class you trade (equities, options or futures); therefore, you should not invest or risk money that you cannot afford to lose. Online trading is not suitable for all investors. View the document titled Characteristics and Risks of Standardized Options at www.TradeStation.com . Before trading any asset class, customers must read the relevant risk disclosure statements on www.TradeStation.com . System access and trade placement and execution may be delayed or fail due to market volatility and volume, quote delays, system and software errors, Internet traffic, outages and other factors.
Securities and futures trading is offered to self-directed customers by TradeStation Securities, Inc., a broker-dealer registered with the Securities and Exchange Commission and a futures commission merchant licensed with the Commodity Futures Trading Commission). TradeStation Securities is a member of the Financial Industry Regulatory Authority, the National Futures Association, and a number of exchanges.
TradeStation Securities, Inc. and TradeStation Technologies, Inc. are each wholly owned subsidiaries of TradeStation Group, Inc., both operating, and providing products and services, under the TradeStation brand and trademark. When applying for, or purchasing, accounts, subscriptions, products and services, it is important that you know which company you will be dealing with. Visit www.TradeStation.com for further important information explaining what this means.

$dellgoing long NYSE:DELL here, we have support and good r/r, dayclose under i take the stoploss, so lets see whats happends

$DELL call verticalI think NYSE:DELL is in the bottom area, and I don't think the market
will tank before Christmas.
NYSE:DELL will rebound.
Bought Dec. 20th $124/$130 call vertical for $2.5.
The profit will be 140% is the stock is above $130 by expiration.
Let's see!

$DELL: OUTLOOKNYSE:DELL : OUTLOOK
Looking for a pullback to my golden zone to ENTER📈
Plan to buy then and ride the move up!
👉 LIKE & FOLLOW for more updates!

DELL - Large Double TopA clear Double Top on this Weekly timeframe, a good time to sell into the bearish movement.
I expect price to move down towards the upward trend line in green and recover from there.
Bearish

next dip is a buy to the all exclusive golden ticket to 150The trend is working its way up and leaving some magic to capture behind in its wake, and a leap to a newer high follows the next dip to the mid-130s.

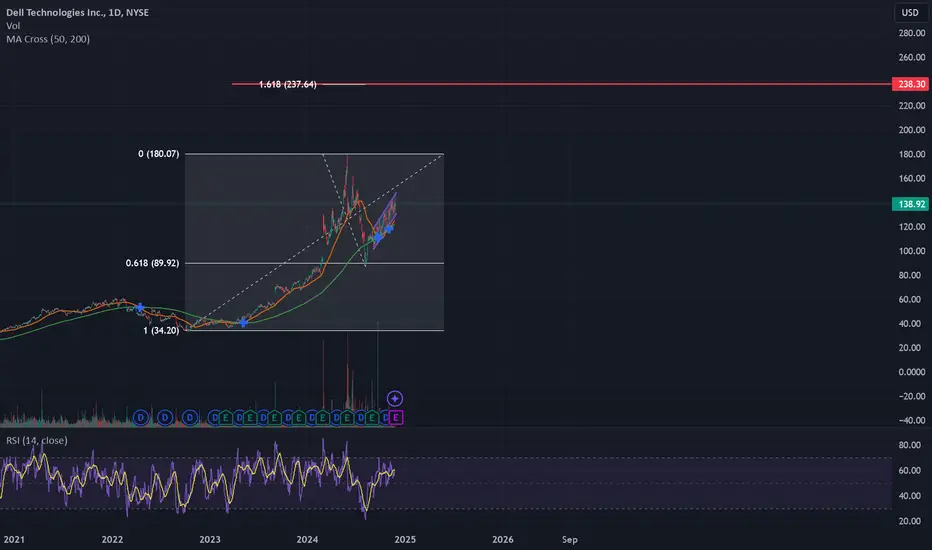
Dell Technologies going up after retracementAfter raising from 33$ to 180$ in a span of ~1.5 years, Dell technologies had a major correction to 0.618 fibonacci level in 2 months. Since then the stock has seen a steady move upward in a narrow channel. Fibonacci extension level of 1.618 indicates price target of 237$ for the next 1-2 years.
Close to Key Resistance with Strong MomentumNYSE:DELL is in a clear recovery phase after a substantial drop. Following the recent uptrend, it’s now approaching a significant resistance level near $135. This resistance level represents a prior high from June, a point where price previously struggled to hold.
Volume has increased slightly on this approach, suggesting that buyers are gaining confidence. However, if the stock fails to break above this level, it could face a pullback to test the support zone around $120.
Watch for a breakout above $135 with volume confirmation, as this could signal a continuation of the upward trend.

MA crossover gives it room to breathe every other is a trend The overbought levels are creeping up, but there is still a retrace on the current trend line, which seems to amazingly come back every two days (a scalper's dream), waiting for confirmation of a drop and the start of a new pattern. Until then, the trend is to continue making new highs, and the next step is the 150 barrier.

DELL a chart earnings **Technical Analysis of Dell Technologies Inc. (DELL) - Daily Chart**
**Overview:**
The daily chart of Dell Technologies Inc. (DELL) reveals several key technical insights that can guide potential trading strategies.
**Trend Analysis:**
1. **Uptrend:** The stock has been following a well-defined uptrend since early 2023, marked by higher highs and higher lows. This trend is represented by a series of ascending trend lines.
2. **Trendline Break:** Recently, the stock has broken above another trendline, indicating a potential acceleration in the uptrend. This breakout suggests strong bullish momentum.
**Support and Resistance Levels:**
1. **Support Levels:**
- **$138.35:** This level has acted as a support zone where the stock has previously found a base before moving higher.
- **$63.34:** Another significant support level, which was tested and held in mid-2024.
- **$26.55:** A longer-term support level from a previous consolidation phase.
2. **Resistance Levels:**
- **$193.37:** This is the current resistance level where the stock has faced selling pressure.
- **$169.31:** An intermediate resistance level that the stock may test before a potential breakout.
**Volume Analysis:**
- **Volume Spike:** There was a noticeable increase in volume during the recent price movements, particularly around the breakout levels. This volume surge confirms the strength of the current trend.
**Technical Indicators:**
1. **RSI (Relative Strength Index):** The RSI is currently near the top of its range, indicating that the stock might be overbought in the short term. This could suggest a potential pullback or consolidation before further upward movement.
2. **ECE Pattern:** The chart shows a series of ECE (Earnings Call Effect) labels, which might indicate that the stock experiences volatility around earnings announcements. Traders should be aware of these events for potential trading opportunities or risks.
**Key Observations:**
- The stock has shown resilience by holding above key support levels and breaking through resistance levels, indicating strong buying interest.
- The breakout above the trendline and resistance levels, coupled with increased volume, suggests a continuation of the uptrend.
**Trading Strategy:**
- **Long Position:** Consider entering a long position if the stock successfully breaks above $193.37 with strong volume. Set a stop loss below the recent support level at $169.31 to manage risk.
- **Short Position:** If the stock shows signs of overbought conditions (RSI nearing or above 70) and fails to break $193.37, a short position could be considered with a stop loss above this level.
**Conclusion:**
Dell Technologies Inc. (DELL) is currently in a strong uptrend with recent breakouts confirming bullish momentum. However, traders should monitor the RSI for potential overbought conditions and watch for volume patterns around key support and resistance levels. Always consider broader market conditions and news events that might impact stock performance.
