Broadcom (AVGO): Is This the Dip You've Been Waiting For?Broadcom (AVGO) has been demonstrating a remarkably strong bullish trend since early April, carving out a clear path of higher highs and higher lows. This robust upward momentum is well-defined by a series of ascending channels.
Trend and Channel Dynamics:
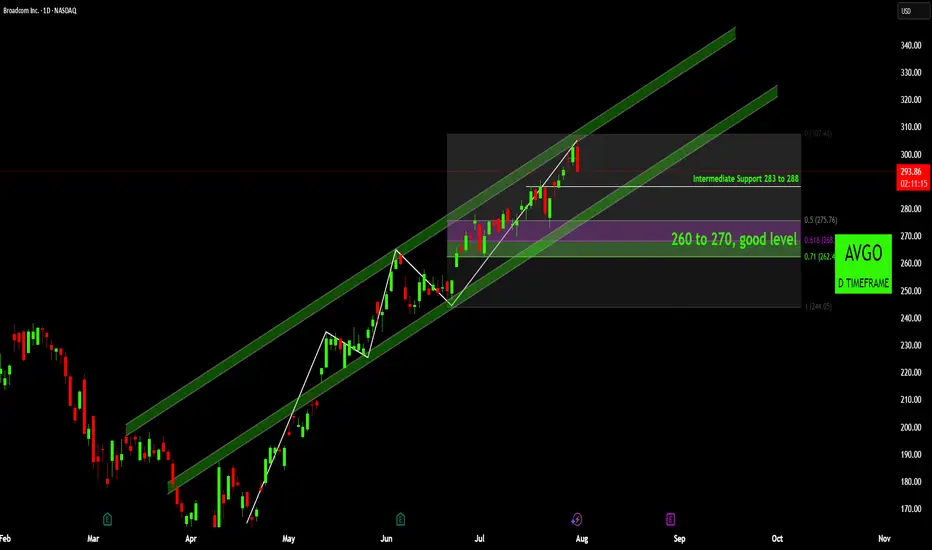
Initially, we observed price action moving steadily within a well-established ascending green channel. The stock showed consistent respect for the channel's boundaries, indicating controlled yet persistent buying pressure. More recently, AVGO broke out above the upper boundary of this initial channel, suggesting an acceleration in momentum. This breakout led the stock into a new, steeper ascending channel, which it has largely been respecting since late June/early July.
Current Price Action and Retracement:
AVGO is currently trading around the $294.10 mark. After reaching a peak just above $307, the stock appears to be undergoing a healthy pullback. This retracement is a natural part of any strong uptrend, allowing for consolidation and the absorption of profit-taking.
Key Support Levels to Watch:
Intermediate Support ($283 to $288): Our first crucial area of interest is the intermediate support zone between $283 and $288. This level aligns closely with prior areas of consolidation and, importantly, the lower boundary of the most recent ascending channel. A test of this area would be a typical and healthy retest of previous resistance now turned support, and a bounce here would signal continued strength within the current channel.
Key "Good Level" Support ($260 to 270) This zone is highlighted as a "good level" for a reason. It perfectly aligns with key Fibonacci retracement levels from the recent major swing low to high:
The 0.5 Fibonacci level at $275.76 sits just above this zone. The crucial 0.618 Fibonacci level is at $268.28. This 'golden ratio' is frequently a strong reversal point in healthy pullbacks. The 0.71 Fibonacci level at $262.44 reinforces the strength of this broader zone. A move into this 260−270 area would represent a deeper but still very much acceptable retracement within a strong uptrend, offering potentially compelling entry or re-entry opportunities for long-term participants.
Overall Outlook:
The current pullback in AVGO should be viewed as a necessary consolidation within a powerful uptrend rather than a sign of weakness. The stock has demonstrated clear impulsive moves followed by corrective retracements throughout its journey higher, as visually reinforced by the white zigzag line.
We will be closely monitoring how AVGO interacts with the 283−288 intermediate support. A successful hold and bounce from this level would suggest a continuation of the upward trajectory. However, if this level is breached, the 260−270 zone becomes the critical area where fresh buying interest is likely to emerge, presenting a lower-risk entry point for those looking to capitalize on AVGO's impressive run.
In summary, AVGO remains firmly in a bullish posture, and these identified support levels offer tactical insights for managing positions or initiating new ones.
Disclaimer:
The information provided in this chart is for educational and informational purposes only and should not be considered as investment advice. Trading and investing involve substantial risk and are not suitable for every investor. You should carefully consider your financial situation and consult with a financial advisor before making any investment decisions. The creator of this chart does not guarantee any specific outcome or profit and is not responsible for any losses incurred as a result of using this information. Past performance is not indicative of future results. Use this information at your own risk. This chart has been created for my own improvement in Trading and Investment Analysis. Please do your own analysis before any investments.
1YD trade ideas

Broadcom Middle of Range RisksI like Broadcom if it gets down to $178. Right now it's still floating from the AAPL news. I wouldn't be inclined to sell here, but if looking to buy (like myself) I'd wait in hopes for $178.
Target (Potential Next Support) $302.
Good luck!

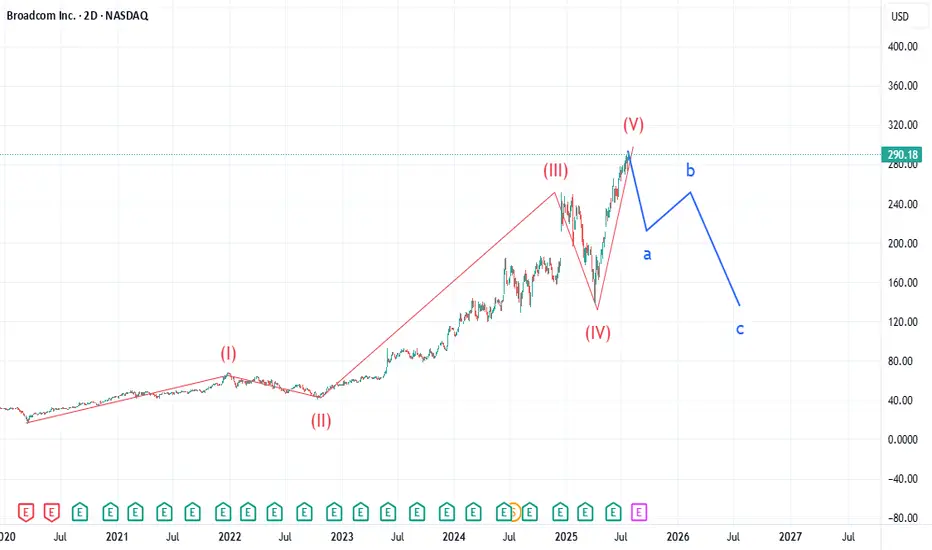
AVGO: Too Many Similarities Market WideLike my chart on BKNG, AVGO is showing an uncanny similarity to Booking.com's chart. Many indices are showing the end of 5 waves in a super cycle dating back to the drop of March 2020. AVGO pt1 is 211. Expecting selling to increase over the next 90 days. Not certain what the catalyst will be, but looking for a major drop in equities over the next 2 weeks. Check IBM chart. I called that drop last week and many stocks will have a similar gap down structure over the next 2 weeks from what I am tracking.
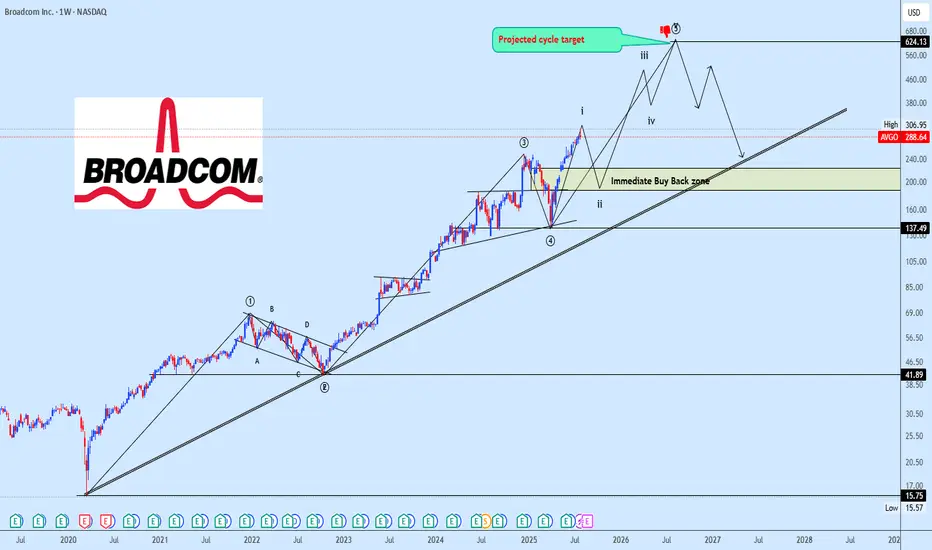
AVGO Bullish Impulse Wave Structure in ProgressAVGO continues its macro advance with a clear 5-wave impulse structure unfolding. The current price action marks the completion of subwave (i) of wave ⑤, setting the stage for a corrective pullback into subwave (ii).
We expect this corrective leg to reach into the 38.2%–50% Fibonacci retracement zone of subwave (i), which will serve as a potential re-accumulation area before the next bullish expansion.
The strategy remains to monitor the development of wave (ii) closely, waiting for key price reaction around the identified retracement zone to build positions in anticipation of subwave (iii) of ⑤ typically the strongest and most impulsive move in Elliott Wave structure.
Targets are shared on the chart for clarity. Patience here is key as we await the right entry zone aligned with technical confluence.
📌 Drop your stock requests in the comment section for quick chart updates — only equity-based assets will be accepted under this post.
$AVGO - channel breakout on the daily.AVGO - Stock in a channel breakout pattern on the daily time frame. Stock broke and held $300 level. Looking for more upside here towards $315 and $330. Stock is decent on the indicator level.
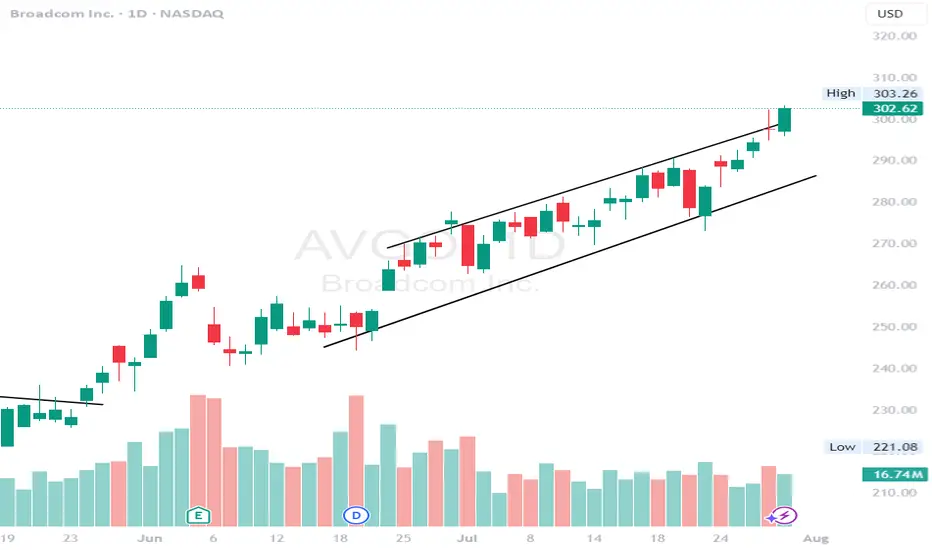
AVGO ( Broadcom.Inc ) NASDAQ:AVGO - Continuation of movement within the ascending channel + potential for a breakout to new historical highs. 🔍 Rationale:
• After a strong correction in the first quarter of 2025, the price formed a reversal and has been moving in a clear ascending channel since the beginning of May.
• The channel support and resistance are clearly being worked out, the price is steadily bouncing off the lower border.
• Bollinger Bands show a narrowing - momentum is possible.
• Trading volume is stable, there are no signs of a strong sell-off.

Broadcom: Positioned for Long-Term Growth in AI and EnterprisesCurrent Price: $283.34
Direction: LONG
Targets:
- T1 = $292.00
- T2 = $305.00
Stop Levels:
- S1 = $280.00
- S2 = $275.00
**Wisdom of Professional Traders:**
This analysis synthesizes insights from thousands of professional traders and market experts, leveraging collective intelligence to identify high-probability trade setups. The wisdom of crowds principle suggests that aggregated market perspectives from experienced professionals often outperform individual forecasts, reducing cognitive biases and highlighting consensus opportunities in Broadcom.
**Key Insights:**
Broadcom (AVGO) is strategically positioned to capitalize on the accelerating adoption of AI and enterprise software solutions. The company’s recent acquisition of VMware represents a significant move into hybrid hardware-software innovation, enhancing its competitive edge. Broadcom’s dominant position in the semiconductor sector and leadership in AI infrastructure fortify its demand, especially as global industries embrace data-driven solutions. Its diversified portfolio and operational prowess allow it to stay resilient amidst volatile market conditions, solidifying investor confidence in its long-term growth trajectory.
Additionally, Broadcom benefits from increasing demand for chipsets supporting high-speed connectivity, cloud infrastructure, and advanced AI computing. These catalysts align with macro trends that position Broadcom for significant revenue expansion in both enterprise and consumer markets.
**Recent Performance:**
Over recent weeks, Broadcom has exhibited strong resilience amid broader semiconductor sector fluctuations. The stock has maintained key technical levels near its current price despite sector-wide challenges. Its foothold in AI-related solutions has ensured robust investor demand. The company has also outperformed key indexes, signifying its defensive qualities against economic headwinds.
**Expert Analysis:**
Market experts consistently favor Broadcom as a go-to investment to gain exposure to AI. Analysts highlight its superior ability to combine ventures in hardware and software, giving it a durable edge over primary competitors like Nvidia and Intel. The VMware acquisition adds another dimension to its business model, diversifying revenue streams while positioning Broadcom as a pioneer in enterprise AI applications. Technical charts indicate a bullish pattern, supported by higher highs and higher lows, signaling an upcoming breakout.
**News Impact:**
Broadcom’s recent acquisition of VMware has bolstered its growth prospects in the enterprise software market. Analysts have noted that this transformational move puts Broadcom at the intersection of cloud computing, artificial intelligence, and enterprise-grade technology solutions. Additionally, the acquisition underscores the company’s commitment to evolving with the rapid pace of technological innovation, making it a compelling investment opportunity.
**Trading Recommendation:**
Broadcom represents a strong long-term opportunity as it leverages its significant competitive advantages in AI, semiconductor technology, and enterprise software. The stock is poised for a bullish breakout, supported by strong fundamentals and positive market sentiment. For investors, the combination of recent catalysts and robust technical setup indicates that this is a high-probability trade, with well-defined price targets and stop-loss levels to manage risk effectively.
AVGO Long1. Broader Market Structure
1.1 Change of Character (CHoCH)
A clear Change of Character occurred at $290.53, where price broke below a prior higher low. This was a key early signal of a potential bearish reversal, as bullish momentum began to weaken and sellers stepped in with conviction.
1.2 Break of Structure (BOS)
Following the CHoCH, a Break of Structure was confirmed at $289.29. Price broke below the prior swing low, confirming a transition to a bearish market structure and validating the developing downtrend.
2. Supply and Demand Zones
Supply and demand zones are pivotal in understanding institutional behavior and predicting likely areas of price reaction.
2.1 Demand Zones (Green)
These zones mark levels where buying pressure has historically been strong, often signaling areas of institutional accumulation.
Zone A: $276.00 – $277.50
Most recent reaction zone with a long lower wick on July 23.
Indicates strong buy-side interest and likely first level of defense if price pulls back.
Zone B: $270.00 – $272.50
A deeper demand zone, formed around July 14–15.
Represents a base for the previous bullish rally and acts as a swing-level support.
Zone C: $269.00 (extreme low)
A structural low marking the last major demand level before a trend breakdown.
A violation here would shift sentiment toward a longer-term bearish outlook.
2.2 Supply Zones (Red)
These are areas of historical selling pressure, often aligning with distribution phases or resistance from unfilled institutional sell orders.
Zone X: $282.50 – $284.00
Formed during the sharp selloff on July 22.
The first upside resistance where sellers may re-enter.
Zone Y: $288.00 – $290.53
High-timeframe supply aligning with the CHoCH and swing high.
Significant distribution zone that must be broken decisively to confirm bullish reversal.
3. Price Action Within the Bordered Region
Price is currently trading around $279.58, just above the local demand zone.
Expecting a pullback into the $276–$277.50 zone (Zone A), allowing liquidity collection and re-entry from institutional buyers.
If this demand zone holds and price forms a higher low, a bullish continuation is likely—targeting the $282.50–$284.00 supply zone.
A further break above this area could attempt to revisit the macro supply at $288–$290.53.
Invalidation: A clean break and close below $276.00 would expose the price to deeper downside into Zone B or Zone C.

AVGO - LONG Swing Entry Plan NASDAQ:AVGO - LONG Swing Entry Plan
Entry Zone 1: $280.80 – $277.00
→ Open initial position targeting +8% from entry level.
Entry Zone 2: $265.50 – $261.00
→ If price dips further, average down with a second equal-sized entry.
→ New target becomes +8% from the average of Entry 1 and Entry 2.
AD Zone : $240.00 – $235.00
→ If reached, enter with double the initial size to lower the overall cost basis.
→ Profit target remains +8% from the new average across all three entries.
Risk Management:
Stop Loss:
Risk is capped at 12% below the average entry price (calculated across all executed positions including the Edit Zone).
Position Sizing Approach:
Entry 1: 1x
Entry 2: 1x
AD Zone: 2x
→ Total exposure: 4x
→ Weighted average determines final TP and SL calculations.
______________________________________
Legal Disclaimer
The information provided in this content is intended for educational and informational purposes only and does not constitute financial, investment, or legal advice or recommendations of any kind. The provider of this content assumes no legal or financial responsibility for any investment decisions made based on this information. Users are strongly advised to conduct their own due diligence and consult with licensed financial advisors before making any financial or investment decisions.
Sharia Compliance Disclaimer: The provider makes no guarantees that the stocks or financial instruments mentioned herein comply with Islamic (Sharia) principles. It is the user’s responsibility to verify Sharia compliance, and consultation with a qualified Sharia advisor is strongly recommended before making any investment decisions

Steal the Breakout: Broadcom Bulls Are In!💎🔓 "Broadcom Break-In: Bullish Vault Raid in Progress!" 🔓💎
🌟Hi! Hola! Ola! Bonjour! Hallo! Marhaba!🌟
Dear Money Makers & Market Robbers 🤑💰✈️,
It’s time for a high-stakes raid on BROADCOM, INC (AVGO) — all based on our secret Thief Trading Strategy™, combining sharp technicals & a sniff of fundamentals.
🕵️♂️ Mission Brief:
Our target is the Bullish Vault – a swing/day trade play with upside momentum. The chart reveals a possible trap at overbought zones where unsuspecting bears get lured in... and we walk out rich! 😏💸
🎯 The Heist Blueprint:
📥 Entry (Buy-In Point):
🚪 “The vault’s open – grab the bullish bags!”
Swipe any bullish setup on the 15m/30m timeframe
Ideal: Buy Limit near recent swing low (support levels)
📳 Set alerts to stay ready – we rob smart, not fast
🛑 Stop-Loss (Escape Plan):
Place SL below recent 30m swing low — approx. 269.00
Adjust by your lot size & number of trades
Don't risk the whole bag – we ain't greedy thieves 😈
📈 Target (Take-Profit Point):
🎯 First Exit Zone: 296.00
💨 Or vanish before the cops (market reversal) arrive
🧲 Scalpers’ Secret:
Only scalp long – don’t fight the bullish flow
Got big capital? Enter early. Small bag? Join the swing crew
Use Trailing SL to guard your stolen gains 🏦🔐
💡 Behind the Heist:
AVGO is showing bullishness thanks to:
📰 Macro Drivers • COT Reports • Institutional Bias
📊 Sentiment Analysis • Index Correlations
💥 Geopolitical Developments – Always stay updated
🔎 Want more intel? Dive into the news, fundamentals, & positioning data that power this trade idea 💣
⚠️ Trade Smart, Thieves:
📛 News events cause chaos – avoid fresh entries during releases
📉 Use trailing stops to secure your loot & dodge slippage
💖 Like the Heist Plan? Hit Boost!
Let’s build the most notorious money-making crew on TradingView! 🚀
Daily gains using the Thief Style™ – not for the faint-hearted.
🔒 Stay sharp, trade like a phantom, and keep stacking that digital cash!
💬 Drop a comment if you’re in the gang – another plan’s coming soon! 🤑🐱👤
📌 Note: This is a general market analysis. Do your own due diligence before risking real capital.
📌 Stay updated — the market changes fast. Adapt or get trapped.

Broadcom Topped?3 Weeks ago AVGO put in a topping tail candle on the weekly and for the past 3 weeks it has failed to close above the topping tail on a weekly basis. I've also highlighted some bearish divergence on the RSI. The topping tail will remain the dominant candle unless AVGO can close above the high of the topping tail on a weekly basis, which is $265.43. AVGO is looking like a prime short candidate. In fact, I would short now given this weeks candle is so close to the topping tails high of $265.43 and then just wait to see where fridays close is. As long as its below the high from the topping tail then the trade is still on, if its above then that cancels the topping tail and the trade would be stopped out. Your stop loss would be a few dollars at most if you enter at current levels

here is the #chart for $AVGOBullish with high expectations. Broadcom ( NASDAQ:AVGO ) is at $269.35, down 0.30% daily but up 11.28% monthly, as shown in the finance card above. X posts and analyst upgrades (HSBC to $400, Bernstein to $295) reflect strong optimism, driven by AI chip demand (projected $28.4B in 2026, $42.8B in 2027) and 25% YoY infrastructure software growth. Technicals show a bull flag breakout, targeting $276.84-$400. However, insider sales ($10.5M by CEO, $13.1M by CLO) and a high valuation (45x trailing earnings) suggest caution. Support is at $266.88; resistance is at $271.85. A break above $271.85 could push toward $295; a drop below $266 risks $260

Broadcom - This was just the first all time high!Broadcom - NASDAQ:AVGO - just created new highs:
(click chart above to see the in depth analysis👆🏻)
Over the course of the past three months, Broadcom has been rallying an impressive +80%. However looking at market structure, all of the previous "dump and pump" was not unexpected. Following this recent bullish strength, Broadcom is likely to channel a lot higher.
Levels to watch: $250, $400
Keep your long term vision!
Philip (BasicTrading)


$AVGO above its previous ATH and holding on. 400 $ reachable. The poster child of the AI rally has been NASDAQ:NVDA and $AVGO. Here we have analysed both the stocks multiple times fundamentally and technically. But the lesser known NASDAQ:AVGO has performed better than the NASDAQ:NVDA since the April lows. NASDAQ:AVGO is still above its previous ATH and closed above yesterday which was 242 $ in Jan 2025. NASDAQ:NVDA is still below its Jan 2025 highs of 152 $.
The Semis index NASDAQ:SMH is also 6.3% below its ATH of 262 $. So not many stocks in this index have a more bullish chart than $AVGO. My assessment is that NASDAQ:AVGO will continue its dominant outperformance in the NASDAQ:SMH sector in comparison to others like $NVDA.
Going back to technical and plotting the Fib Extension levels form the last bull run before Aug 2024 we can see that the next possible near-term target is 275 $, a 10% upside form here and in the medium term the target is 400 $.
Verdict : Long NASDAQ:AVGO over NASDAQ:SMH and $NVDA. First Target 275 $ then we go to 400 $.

AVGO – All-Time High Breakout with Flag Pattern TriggerBroadcom ( NASDAQ:AVGO ) is breaking out of an 11-day consolidation flag, pushing through the trendline and into all-time highs — a textbook momentum setup.
🔹 Flag Pattern Breakout
After a strong run, NASDAQ:AVGO spent 11 days chopping in a tight flag just under highs.
Today, we’re seeing a clean trendline break, signaling the start of a potential fresh leg higher.
ATH breakout + flag pattern = momentum trader’s dream.
🔹 My Trade Plan:
1️⃣ Entry: Long on the flag breakout and trendline break.
2️⃣ Risk Level: Stop is down at $247, just under the consolidation base.
3️⃣ Target: Riding the trend — trailing stop strategy once price confirms above highs.
Why I Like This Setup:
Strong consolidation near highs = no weakness.
Breakout is happening with clean structure and clear volume pickup.
NASDAQ:AVGO is a leader name — when it goes, it goes.
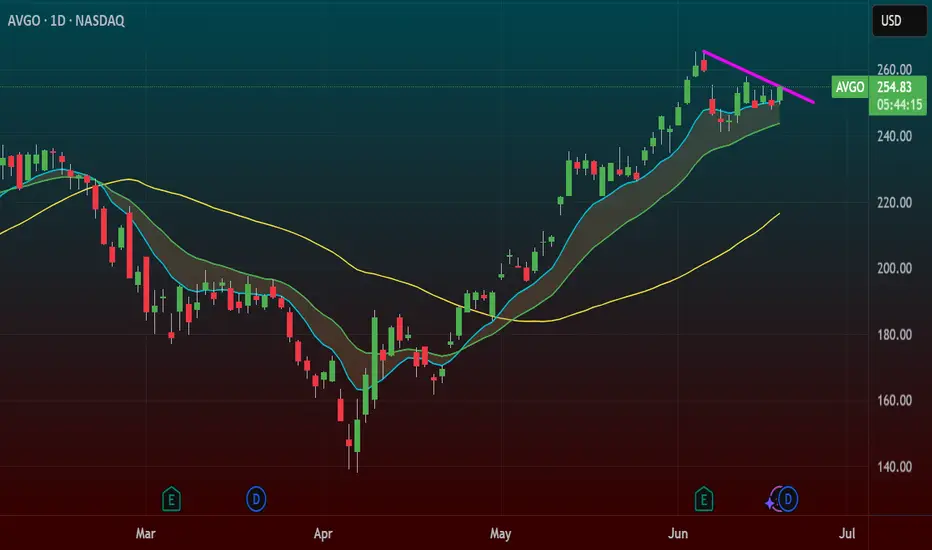
AVGO CRACK!Fun while it lasted.
Even though I like AVGO, a crack is a crack is a crack!
Rising bearish wedge.
Time to take profits.

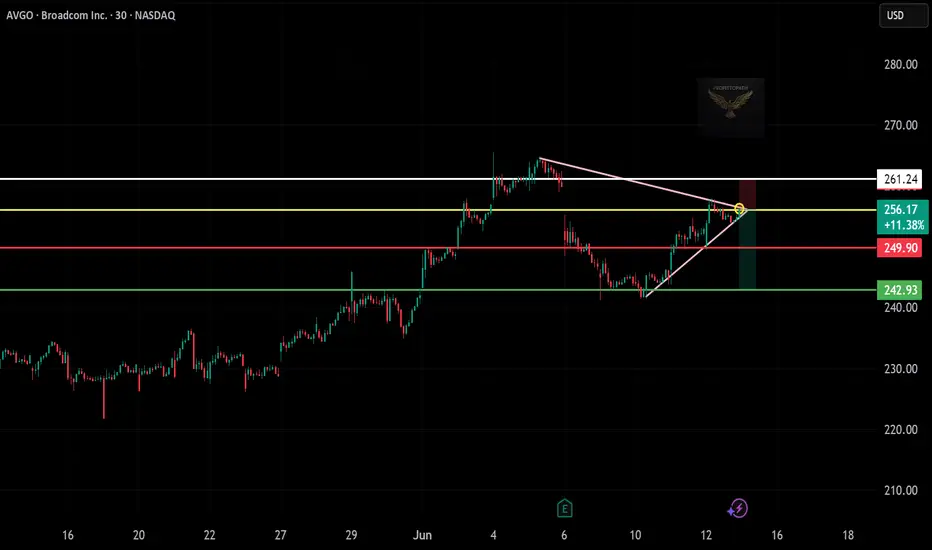
AVGO Short Setup: Rising Wedge Rejection!""
Simple Breakdown:
Pattern: Bearish rising wedge + resistance rejection
Entry: $256.17 (yellow zone rejection)
Stop Loss: $261.24 (wedge top resistance)
Target: $242.93 (previous support zone)
Risk/Reward: Approx. 1:2.6 ✅
AVGO is always an easy decision for me -- long at 246.86 In addition to being at the heart of AI and having margins north of 70%, AVGO has done incredibly well with my algo. 381-0 with an average return of 1.71% in an average of 7 days - a .244% per day return, about 4x the average daily market return. However, adding the new filter I've been using ups that number dramatically. In the last 2 years, in 39 trades, it's 39-0 with an average return of 2.24% and an average of 3.6 days held. That's .63% per day or almost 15x the daily average return of the market.
Only 6 of those 39 trades took more than one week to close and none took longer than a month. Only 10 of them made less than 1% and 7 made more than 4%. Combined with the fundamentals, the uptrend it's in, and the fact that it's sitting right on support makes the reward to risk ratio VERY high for me.
The exit strategy Is FPC if the return is large enough, but not necessarily a FPC.
As always - this is intended as "edutainment" and my perspective on what I am or would be doing, not a recommendation for you to buy or sell. Act accordingly and invest at your own risk. DYOR and only make investments that make good financial sense for you in your current situation.

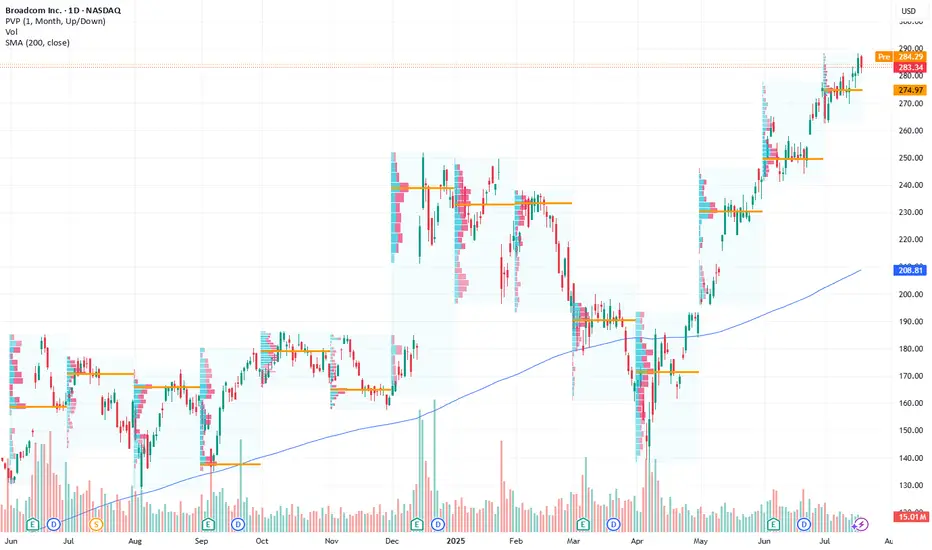
Broadcom Dips After EarningsBroadcom is pulling back after reporting quarterly results, and potential buyers may be waiting.
The first pattern on today’s chart is the price zone between the late-May weekly low of $221.60 and the February high of $237.93. This may be an initial area where traders look for support.
Second, the 21-day exponential moving average (EMA) is approaching from below. That may suggest the chip stock’s short-term trend is still bullish.
Third, Wilder’s Relative Strength Index (RSI) is dipping from an overbought condition. A reading closer to the midpoint around 50 could potentially satisfy investors worried about chasing.
Finally, AVGO is an active underlier in the options market. (Its average daily volume is about 240,000 contracts in the last month.) That could make it easier for traders to take positions with calls and puts.
Check out TradingView's The Leap competition sponsored by TradeStation.
TradeStation has, for decades, advanced the trading industry, providing access to stocks, options and futures. If you're born to trade, we could be for you. See our Overview for more.
Past performance, whether actual or indicated by historical tests of strategies, is no guarantee of future performance or success. There is a possibility that you may sustain a loss equal to or greater than your entire investment regardless of which asset class you trade (equities, options or futures); therefore, you should not invest or risk money that you cannot afford to lose. Online trading is not suitable for all investors. View the document titled Characteristics and Risks of Standardized Options at www.TradeStation.com . Before trading any asset class, customers must read the relevant risk disclosure statements on www.TradeStation.com . System access and trade placement and execution may be delayed or fail due to market volatility and volume, quote delays, system and software errors, Internet traffic, outages and other factors.
Securities and futures trading is offered to self-directed customers by TradeStation Securities, Inc., a broker-dealer registered with the Securities and Exchange Commission and a futures commission merchant licensed with the Commodity Futures Trading Commission). TradeStation Securities is a member of the Financial Industry Regulatory Authority, the National Futures Association, and a number of exchanges.
Options trading is not suitable for all investors. Your TradeStation Securities’ account application to trade options will be considered and approved or disapproved based on all relevant factors, including your trading experience. See www.TradeStation.com . Visit www.TradeStation.com for full details on the costs and fees associated with options.
Margin trading involves risks, and it is important that you fully understand those risks before trading on margin. The Margin Disclosure Statement outlines many of those risks, including that you can lose more funds than you deposit in your margin account; your brokerage firm can force the sale of securities in your account; your brokerage firm can sell your securities without contacting you; and you are not entitled to an extension of time on a margin call. Review the Margin Disclosure Statement at www.TradeStation.com .
TradeStation Securities, Inc. and TradeStation Technologies, Inc. are each wholly owned subsidiaries of TradeStation Group, Inc., both operating, and providing products and services, under the TradeStation brand and trademark. When applying for, or purchasing, accounts, subscriptions, products and services, it is important that you know which company you will be dealing with. Visit www.TradeStation.com for further important information explaining what this means.

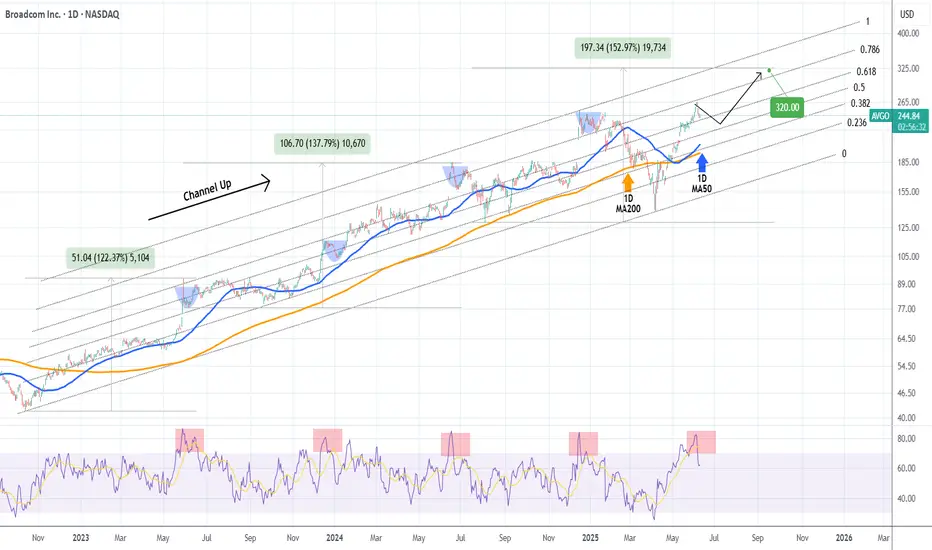
BROADCOM Pull-back to demand zone possible before new High.Broadcom Inc. (AVGO) is currently on a 3-day pull-back that started right on the 0.786 Fibonacci level of the 2.5 year Channel Up. The 1D RSI got heavily rejected from deep inside the overbought zone (>70.00) to back down below it and the only times that happened within this pattern, was during short-medium term pull-backs towards its 1D MA50 (blue trend-line).
As a result, the current pull-back can extend a little more towards the 1D MA50 and then rebound. Given a +15% added increas on each Bullish Leg of the Channel Up, we expect to see $320 next.
-------------------------------------------------------------------------------
** Please LIKE 👍, FOLLOW ✅, SHARE 🙌 and COMMENT ✍ if you enjoy this idea! Also share your ideas and charts in the comments section below! This is best way to keep it relevant, support us, keep the content here free and allow the idea to reach as many people as possible. **
-------------------------------------------------------------------------------
💸💸💸💸💸💸
👇 👇 👇 👇 👇 👇
BUY OPPORTUNITYInstrument: AVGO
Entry Price: $234.70
Stop Loss (SL): $224.50
Take Profit (TP): $261.35
Time Frame: 4H
Technical Analysis:
Price Action:
Broadcom recently hit an all-time high and is now retracing towards strong demand zones around $235.60 and $230.60. These levels have acted as significant support in the past, leading to a bounce-back.
The demand levels around $235.6 and $230.6 are critical for a potential reversal. A bounce from these zones can drive the price up towards local resistance levels near $259 and $263.
Stochastic RSI:
Currently pointing downward but approaching oversold territory, suggesting an imminent bounce or rally back to resistance levels.
Risk-Reward Ratio:
With the entry, stop loss, and take profit set, the trade offers a favorable risk-reward ratio of greater than 1:2, making it an attractive setup.
Fundamental Catalyst:
Broadcom has declared a quarterly dividend of $0.59 per share, with an ex-dividend date set for June 20, 2025, and payable on June 30, 2025. This dividend underscores Broadcom’s strong financial health and commitment to rewarding shareholders.
