Why $AVGO is an AI player1/ 🧵 With the rapid development of AI technology, Broadcom (AVGO) is poised to benefit significantly in its wired infrastructure business. Here’s why AVGO’s wired infrastructure is set to thrive in the AI era.
2/ 🌐 Explosive data traffic growth: AI applications require massive data processing and transmission, driving the demand for high-speed, reliable data transfer and network infrastructure. Broadcom’s Ethernet switch chips and fiber optic modules are crucial to meeting these demands.
3/ 📊 Increased data center demand: The rise of AI and cloud computing is fueling global data center expansion. Broadcom’s wired infrastructure products ensure efficient data center operations, supporting high-speed data exchange and low-latency networks.
4/ 💡 Importance of optical networks: AI applications often involve large-scale datasets and real-time processing. Optical networks offer unparalleled advantages in providing high-speed, low-latency connections. Broadcom’s fiber optic modules and related products have significant market competitiveness in this area.
1YD trade ideas

Mind the gap! What next for Broadcom?Broadcom (AVGO) has been a major beneficiary of the AI boom, with its stock soaring 53% since the beginning of 2024 and more than doubling year-to-date. While not reaching the astronomical heights of NVIDIA (NVDA), Broadcom's performance remains remarkable.
The company's Q2 revenue report was a resounding success, showing a 43% year-over-year increase, while EBITDA grew 31% year-over-year. This strong performance prompted Broadcom to announce a 10:1 stock split on July 15th, a move that will make the stock more accessible to smaller retail investors.
The sustainability of this growth in the rapidly evolving AI landscape remains a key question for any AI-related company. However, Broadcom's forward P/E ratio of 35 appears relatively modest compared to its AI peers like NVIDIA (50), CrowdStrike (95), and AMD (46). This suggests that Broadcom may still have room for further valuation expansion.
Following the impressive earnings report, the stock surged 12% on June 13th and continued to trade higher in after-/pre-market activity. The technical picture is also positive, with the price comfortably above its short, mid, and long-term moving averages, indicating strong momentum. The recent surge in volume, reflected in the Volume Oscillator, further underscores the heightened interest in the stock.
While the Relative Strength Index (RSI) is currently in overbought territory at 79.23, this is not unusual following a major earnings announcement. Importantly, the RSI's moving average has been trending upwards since early May, suggesting that the bullish momentum behind AVGO may not be exhausted yet.
Furthermore, the overall market sentiment towards AI remains positive, which could continue to support Broadcom's growth trajectory. Yet it remains important to monitor Broadcom's competitive position in the Semiconductor Solutions & Infrastructure Software market, as the landscape is constantly evolving.
Risk Management: Despite the positive outlook, investors should be mindful of potential risks, such as a slowdown in AI adoption or increased competition, and employ appropriate risk management strategies.

AVGO: Buy ideaWe have the strong break of the resistance line. This means that we would have a high probability of having an upward trend.

AVGO, Split coming? On it's way to 1550?The chart for Broadcom Inc. (AVGO) on the NASDAQ shows a bullish breakout from a falling wedge pattern, indicating a potential upward price movement.
After the breakout, the price has consolidated around the $1,406.64 level, suggesting a healthy pause before the next move.
The RSI at 57.48 indicates neutral to slightly bullish momentum, and increased volume during the breakout adds credibility to this move.
The projected path suggests the price will consolidate around $1,407.78 before breaking out to $1,419.17 and potentially reaching $1,438.35 and $1,445.40. Considering these factors, entering a long position if the price breaks above $1,419.17
with strong volume could be beneficial, with a stop loss below $1,391.91 to manage risk and targets at $1,438.35 and $1,445.40.
This could easily tun to 1550 with a 10% implied move on earnings.
Disclaimer: This analysis is for educational purposes only and should not be considered financial advice. Always conduct your own research and consult a financial advisor before making any trading decisions.

Broadcom's Robust Earnings, Strategic Stock Split, and AI-DrivenBroadcom Inc. has showcased strong financial performance and strategic advancements in its latest quarterly report. The company exceeded analysts’ expectations with adjusted earnings per share (EPS) of $10.96 and revenue of $12.49 billion for the second fiscal quarter. This impressive outcome led to a 10% increase in after-hours trading.
In addition, Broadcom announced a 10-for-1 stock split effective July 15, aimed at increasing share accessibility for retail investors.
AI technology remains a significant growth driver for Broadcom. The company reported $3.1 billion in AI-related revenue for the quarter and increased its AI revenue forecast for 2024 to $11 billion. Broadcom’s diversified AI operations and partnerships with tech giants like Google position it well for future growth.
The 5G market also presents substantial opportunities for Broadcom. The company generated $5.9 billion in 5G revenue in 2023 and expects continued growth as the global market expands.
Despite facing challenges such as competition from Qualcomm and geopolitical tensions, Broadcom’s strategic acquisitions and strong market presence support its positive outlook.

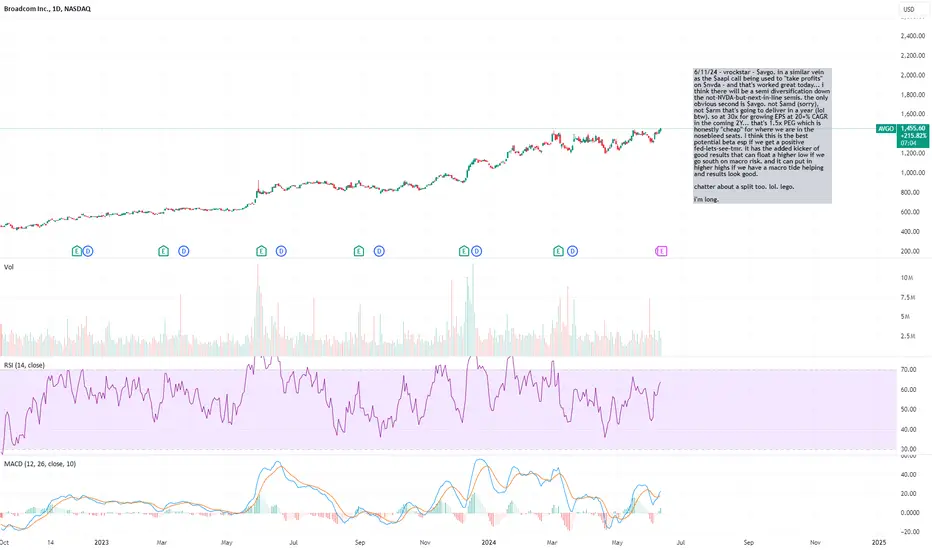
6/11/24 - $avgo - from nvda -> avgo. long into tmr PM print6/11/24 - vrockstar - $avgo. in a similar vein as the NASDAQ:AAPL call being used to "take profits" on NASDAQ:NVDA - and that's worked great today (go read that note i wrote on friday for context if interested on NASDAQ:AAPL )... i think there will be a semi diversification down the not-NVDA-but-next-in-line semis. the only obvious second is $avgo. not NASDAQ:AMD (sorry), not NASDAQ:ARM that's going to deliver in a year (lol btw). so at 30x for growing EPS at 20+% CAGR in the coming 2Y... that's 1.5x PEG which is honestly "cheap" for where we are in the nosebleed seats. I think this is the best potential beta esp if we get a positive fed-lets-see-tmr. it has the added kicker of good results that can float a higher low if we go south on macro risk. and it can put in higher highs if we have a macro tide helping and results look good.
chatter about a split too. lol. lego.
i'm long.
Broadcom (AVGO): Set for a New High or Due for a Pullback?Since the COVID-19 low in March 2020 at $155, Broadcom has seen an incredible surge, similar to Nvidia's performance. The stock has skyrocketed by an astounding 840% since that low. This massive run-up makes the analysis challenging, but we've identified the Wave (1) and Wave (2) structures of this upward movement.
The internal wave structure is not clear, making it difficult to analyze further. Broadcom has had only one sideways range between $780 and $922. Otherwise, the stock has been moving parabolically upwards.
A significant trendline, initially touched at Wave (1), has been broken five or six times, with the seventh touch holding as support. Given the upcoming earnings report, we believe Broadcom could rise to the $1,600 to $1,800 range, with a maximum potential target of $2,300 or higher.
Realistically and statistically, we anticipate a pullback for Wave (3) between the 227.2% and 261.8% levels. However, it's also possible that Broadcom continues its upward trajectory without interruption, similar to Nvidia.
Today's earnings report will be crucial in determining the next move for Broadcom. We will be watching closely to see if the stock continues its parabolic rise or if we get the pullback.

AVGO - 3 months RECTANGLE══════════════════════════════
Since 2014, my markets approach is to spot
trading opportunities based solely on the
development of
CLASSICAL CHART PATTERNS
🤝Let’s learn and grow together 🤝
══════════════════════════════
Hello Traders ✌
After a careful consideration I came to the conclusion that:
- it is crucial to be quick in alerting you with all the opportunities I spot and often I don't post a good pattern because I don't have the opportunity to write down a proper didactical comment;
- since my parameters to identify a Classical Pattern and its scenario are very well defined, many of my comments were and would be redundant;
- the information that I think is important is very simple and can easily be understood just by looking at charts;
For these reasons and hoping to give you a better help, I decided to write comments only when something very specific or interesting shows up, otherwise all the information is shown on the chart.
Thank you all for your support
🔎🔎🔎 ALWAYS REMEMBER
"A pattern IS NOT a Pattern until the breakout is completed. Before that moment it is just a bunch of colorful candlesticks on a chart of your watchlist"
═════════════════════════════
⚠ DISCLAIMER ⚠
The content is The Art Of Charting's personal opinion and it is posted purely for educational purpose and therefore it must not be taken as a direct or indirect investing recommendations or advices. Any action taken upon these information is at your own risk.

AVGO Set for Explosive Growth,Buy Before Skyrocketing to $1,800!Broadcom Inc. (NASDAQ: AVGO) has been trading within a well-defined upward channel since October 2022. The stock recently experienced a pullback, presenting a potential last opportunity for accumulation before a significant upward move. The stock closed at $1,399.20, down by 1.05% from the previous close, indicating a minor correction within its ongoing bullish trend.
Price Action and Indicators
Moving Averages: The 10-day, 50-day, and 200-day moving averages (MA) are positioned below the current price, suggesting strong bullish momentum. The 10-day MA is at $1,377.04, the 50-day MA at $1,314.43, and the 200-day MA at $1,121.95.
Relative Strength Index (RSI): The RSI (14) stands at 58.98, indicating a neutral condition but leaning towards bullish as it is above 50. There is room for upward movement before entering the overbought territory.
Bollinger Bands: The Bollinger Bands indicate a range between $1,332.27 and $1,446.06. The price is currently within the upper band, suggesting potential for further gains.
Volume: The recent volume of 1.53M is above the average 30-day volume of 2.29M, indicating strong trading activity and interest in the stock.
AVGO has been following an upward channel, with higher highs and higher lows. The current position within this channel indicates potential for a continuation of this trend.
Accumulation Phase: The stock is in a new accumulation phase within the upward channel, marked by consolidation around the $1,400 level. This phase typically precedes a breakout.
Double Bottom Formation: The RSI shows a double bottom formation, suggesting a reversal of the recent downtrend and an upcoming bullish move.
Long Position:
Entry Point: A strong buy signal is evident at the current price level of $1,399.20, with confirmation if the price surpasses $1,410.
Price Target: The immediate price target is $1,500, with a longer-term target of $1,800 as per the channel projection.
Stop Loss: Set a stop loss at $1,320, slightly below the 50-day MA, to mitigate risk.
Short Position:
Entry Point: Consider a short position only if the price breaks below the 50-day MA at $1,314.43, indicating a trend reversal.
Price Target: The short-term target for a downward move would be $1,200, aligning with previous support levels.
Stop Loss: Place a stop loss at $1,350 to cover potential rebounds within the channel.
Conclusion
Broadcom Inc. exhibits strong bullish characteristics with its adherence to the upward channel and the current accumulation phase. Given the technical indicators and chart patterns, a long position is recommended with a price target of $1,500 in the short term and $1,800 in the long term. A short position should only be considered if significant support levels are breached, with tight stop losses to protect against volatility. Investors should stay vigilant for market news and earnings reports that could impact the stock's trajectory.

BROADCOM accumulating. Last opportunity to buy on this pull-backBroadcom Inc. (AVGO) has been trading within a long-term Channel Up since the October 13 2022 market bottom. The stock is now within the new Accumulation Phase that is being supported by the 1D MA100 (green trend-line).
Based on the previous Accumulation Phase, we should get one (or two max) more pull-back towards the 1D MA100, before the price breaks upwards aggressively towards the Channel's top (Higher Highs trend-line).
Last time the ultimate buy signal was when the 1D RSI made a Double Bottom. Our Target is $1800, which will be on the 3.0 Fibonacci extension, similar to the December 15 2023 High.
-------------------------------------------------------------------------------
** Please LIKE 👍, FOLLOW ✅, SHARE 🙌 and COMMENT ✍ if you enjoy this idea! Also share your ideas and charts in the comments section below! This is best way to keep it relevant, support us, keep the content here free and allow the idea to reach as many people as possible. **
-------------------------------------------------------------------------------
💸💸💸💸💸💸
👇 👇 👇 👇 👇 👇

Stay FAR Away From This Over-Hyped Tech StockHey guys! Today we're talking about Broadcom NASDAQ:AVGO , which we think is the poster child for AI hype in stocks these days. In our view, shares of the semiconductor company are trading WAY above 'Fair Value', and the stock has 30%+ downside risk.
While Broadcom's operations appear well-run and profitable, we think investors would be served by steering clear until shares dip considerably.
Want more high-quality trade ideas? Follow us below. ⬇️⬇️

AVGO April 26, 2024: Coming BackOn April 26, 2024, NASDAQ:AVGO is among the first stocks that went back above MA-20 and MA-50 while the main indices SP:SPX and NASDAQ:NDX are still below their own MA-20, MA-50.
An aggressive buy point is here. A confirmation is when NASDAQ:AVGO broke out the yellow trendline shown on the chart.

AVGO April 17, 2024: A Sell SignalOn April 17, 2024, NASDAQ:AVGO closed down below its MA-50 AND the previous support since March 21.
Which is a sell signal.
As shown on the chart, the target price for this decline is around $1200.

Technical Analysis of Broadcom Inc. (AVGO)Broadcom Inc. (AVGO) is exhibiting a confluence of technical indicators that suggest a pivotal juncture for its stock price movement. The daily chart encapsulates a symphony of technical patterns and oscillators that signal a tenuous equilibrium between bullish and bearish forces.
Price Action & Volume:
The latest candlestick on AVGO's chart presents a diminutive red body with a minor upper shadow and no visible lower shadow, indicating a slight bearish inclination within a trading range. The stock closed at $1318.29, down 1.18% for the session. Despite this modest pullback, the candle’s position above the Ichimoku cloud and the 50-day moving average portrays a primary bullish bias. Volume, while marginally lower than the 30-day average, failed to provide a convincing narrative for a trend reversal, sitting at 767.67K.
Ichimoku Cloud:
AVGO is trading above the Ichimoku cloud, an inherently bullish signal, although proximity to the cloud's upper span warrants caution. The Tenkan-sen (red line) remains above the Kijun-sen (blue line), reinforcing the bullish stance. However, the slight contraction of the cloud ahead indicates potential volatility and consolidation.
Fibonacci Retracement:
The Auto Fibonacci Retracement tool highlights a consolidation zone with support around the $1309.17 level (0.236 retracement) and resistance near $1353.70 (0% retracement). This pivotal area could determine the trajectory of AVGO in the short to medium term.
Oscillators:
The Relative Strength Index (RSI) is neutral at 56.05, veering away from the overbought territory, suggesting that there is room for price movement in either direction without immediate overextension concerns. The Moving Average Convergence Divergence (MACD) exhibits a bearish crossover with the signal line above the MACD line, although the histogram's light bars indicate the momentum of the bearish move is waning. The On-Balance Volume (OBV) sits at 528.05M, which has been stable, pointing towards an equilibrium in buying and selling pressure.
Moving Averages:
The exponential moving averages (EMAs) configuration suggests a constructive backdrop for bullish scenarios, with the price holding above the key moving averages.
Speculative Price Targets:
Looking ahead, should the bulls recapture the momentum and the price consolidates above the 0% Fibonacci level, AVGO could target the previous swing high around $1400, aligning with the upper resistance band. Alternatively, if bearish sentiment takes hold and the stock price breaches below the 0.236 Fibonacci level, we could witness a retracement towards the $1300 psychological support or further down to the 0.382 retracement level at $1283.42.
Conclusion:
In summation, AVGO's technical posture suggests a tug-of-war between continuation and consolidation. The bullish trend is challenged by immediate resistance levels and oscillator signals that call for caution. Investors should monitor the Fibonacci levels for potential directional cues while keeping a vigilant eye on broader market sentiment and upcoming earnings reports that could serve as a catalyst for the next decisive move. As always, maintain risk management protocols to navigate the inherent uncertainties of the market landscape.

AVGO breakout imminentLooks like AVGO will move higher from here. I bought the April 19th 1320/1310 bull put spread for -2.67

$AVGO - we have a new LH👀NASDAQ:AVGO
If the price remains below 1403.50, then this is our new LH.
A failure to hold 1205 will form a new LL and a start of a downtrend.
The candles of the past 4 days show weakness.
My targets are: 1300-1275-1250-1200.
Daily chart:

AVGO dips for a buy now $50 under ATH LONGAVGO is asking to be chased. On the daily chart, the price is now $50 below the ATH of
the top of of the month. RSI on the lower TF green line has pulled back to 72 from 85.
The longer TF black line is admittedly in overbought territory. The longterm growth
expectations of the AI stock defy ordinary technical analysis, AVGO is 3-4% below the ATH.
I see this as an opportunity to diversify in AI stocks by getting a small position in BroadCom
to supplement NVDA, MU and INTC. I am looking at TXN as it has a lower price tag and is
about 10% below ATH. ( The growth prospects need a look to see if they are there.)
I expect AVGO to compete well in the space and can see that it is making agreements with
some other companies well situated in AI .


Correction Coming for AI? AI technology has been recognized as the new future since the end of 2022. The rapid advancements in AI and its stock prices sparked debates regarding the sustainability of its current valuations.
Indeed, AI technology has a long runway ahead, but like all journeys, it will eventually encounter a bend. In today's tutorial, we are going to study its fundamental and technical reasons why we may have to prepare for a windy and bumpy ride ahead.
E-mini Nasdaq Futures & Options
Ticker: NQ
Minimum fluctuation:
0.25 index points = $5.00
Micro E-mini Nasdaq Futures & Options
Ticker: MNQ
Minimum fluctuation:
0.25 index points = $0.50
Disclaimer:
• What presented here is not a recommendation, please consult your licensed broker.
• Our mission is to create lateral thinking skills for every investor and trader, knowing when to take a calculated risk with market uncertainty and a bolder risk when opportunity arises.
CME Real-time Market Data help identify trading set-ups in real-time and express my market views. If you have futures in your trading portfolio, you can check out on CME Group data plans available that suit your trading needs www.tradingview.com

AVGO Broadcom Options Ahead of EarningsAfter the Head and Shoulders chart pattern was perfectly completed:
and the bullish trend started:
Now analyzing the options chain and the chart patterns of AVGO Broadcom prior to the earnings report this week,
I would consider purchasing the 1380usd strike price Calls with
an expiration date of 2024-6-21,
for a premium of approximately $129.85.
If these options prove to be profitable prior to the earnings release, I would sell at least half of them.

Broadcom Revenue Beats Estimates As AI Powers DemandTech giant Broadcom ( NASDAQ:AVGO ) surpasses market expectations for first-quarter revenue fueled by heightened demand for advanced networking chips powering artificial intelligence (AI) applications. However, shares dip post-announcement amidst mixed investor sentiments.
Key Highlights:
Broadcom's robust performance in the first quarter underscores the pivotal role of AI in driving demand for cutting-edge networking solutions, particularly within cloud infrastructure. While smaller rival Marvell Technology faces challenges with weak demand for custom AI chips, Broadcom ( NASDAQ:AVGO ) stands resilient with its diversified portfolio and strategic positioning in the AI computing landscape. Despite maintaining a conservative annual revenue forecast, Broadcom's continued growth trajectory and expansion into software and tech firms affirm its status as a key player in the evolving tech ecosystem.
Market Dynamics:
The surge in demand for infrastructure upgrades, driven by the proliferation of generative AI applications, propels Broadcom's semiconductor solutions segment, albeit falling slightly short of revenue estimates. Infrastructure software revenue experiences a significant uptick, surpassing expectations and contributing to Broadcom's overall revenue growth.
Future Outlook:
Broadcom's entrenched position in AI-driven data center infrastructure positions it as a prime beneficiary of the ongoing AI revolution. Continued investments in software and tech acquisitions, coupled with sustained innovation in networking solutions, are poised to drive Broadcom's future growth and market relevance.
Conclusion:
Broadcom's ( NASDAQ:AVGO ) resilience in navigating market challenges while capitalizing on emerging opportunities reaffirms its status as a leading player in the tech industry. As AI continues to reshape the technological landscape, Broadcom's ( NASDAQ:AVGO ) expertise in providing essential networking solutions places it at the forefront of innovation and growth.

AVGO: Pre-Earnings Bearish Gartley at ResistanceThere is a Potential Bearish Gartley at Resistance on AVGO leading to the earnings report. I'm not sure if it will hold but I have gotten some calls on SOXS just in case so I want to archive this harmonic setup.

AVGO's climb is now coming to an endAVGO has done extremely well due to earnings reports and releases and AI implementation in the past couple of months but now that stock surge is coming to a trend reversal. FVG analysis shows there are previous gaps that haven't been covered yet. This is further proven by the gravestone doji that we saw at yesterday's close. Today, the stock saw -4% and that red candle confirmed that the uptrend broke and the stock is now coming to a reversal.
Yes, of course, the market will retest itself and go up in the next couple of days but with a fair opportunity, it is time to short AVGO. forecasted price to exit: $1080-1120.
