Old Mutual LongOld Mutual Limited Ord Npv (Di) is listed on the London Stock Exchange,
trading with ticker code OMU. It has a market capitalisation of £3,711m,
with approximately 4,709m shares in issue. Over the last year,
Old Mutual Lim. share price has been traded in a range of 41.3, hitting a high of 84.65, and a low of 43.35.
2KS trade ideas


Old Mutual: Solid Reversal, Consider Partially ReducingOMU just about traded into my provisional accumulation zone (yellow circled areas), a level which was set two weeks earlier (05 July) and highlighted in my client report. The price has strongly reversed higher, following the expected path on the back of it's market update among other factors. From just above 1200c to 1463c, it may be time to partially reduce the position as it nears swing highs (short term view).
For access to these and other insights and ideas, get in touch today.

OMU long ideaAnother one that keeps on promising. JSE:OMU is inching closer to the resistance level, I'd like to see the price break above this level. A good dividend payer. I'm bullish on financials, and the JSE:STXFIN pulled a good move today (I have a position on TFSA).


Old Mutual - 200SMA Bounce with upward momentumJSE:OMU recently bounced nicely off of the 200 Simple Moving Average and started to in an upward direction. It is also showing signs of great upward momentum so I think we could be looking at a nice upward move towards the previous resistance level at around 1480

$JSEOMU triggered a buy today...$JSEOMU triggered a buy today...aslo take a look at Sanlam similar setup.

OLD MUTUALOUT OF THE DESCENDING TRENDLINE.
NICE BOUNCE 2/3 ABOVE R12,91 ZONE .... FULL EXHAUSTION , NOW WAITING FOR A BULLISH CANDLE ON THE WEEKLY

OLD MUTUAL - LONG Swing Idea- Old Mutual is coming off oversold levels and found support on the 200 day moving average
- Low risk swing idea for a move back towards R14 level (1st target)
-- MANAGE YOUR RISK - -
Disclaimer: All ideas are my opinion and should not be taken as financial advice.


OLD MUTUAL #OMU Ready preparing to break?After teasing with a break to the upside Ood Mutual (JSE:OMU) has remained within the medium term pennant, and is currently wedged between the 50MDA and 200MDA. A dialy close above or below either one of the two could confirm the direction of a break. With BV/S at 14.23 the bets is on for an upside break, target the Feb high with stops below 12.00, or 11.60

Old Mutual turning upJSE:OMU has bounced nicely off of the 200 simple moving average, failed to make a lower low and seems to be turning upwards for a long position. Momentum indicators are also start showing a move to the upside. We could possibly go to the previous highs around the 1500 level.


Old MutualConfluence of support on the #dailychart;which is also coinciding with the 200dma; could we get a bounce back to 14 and above?

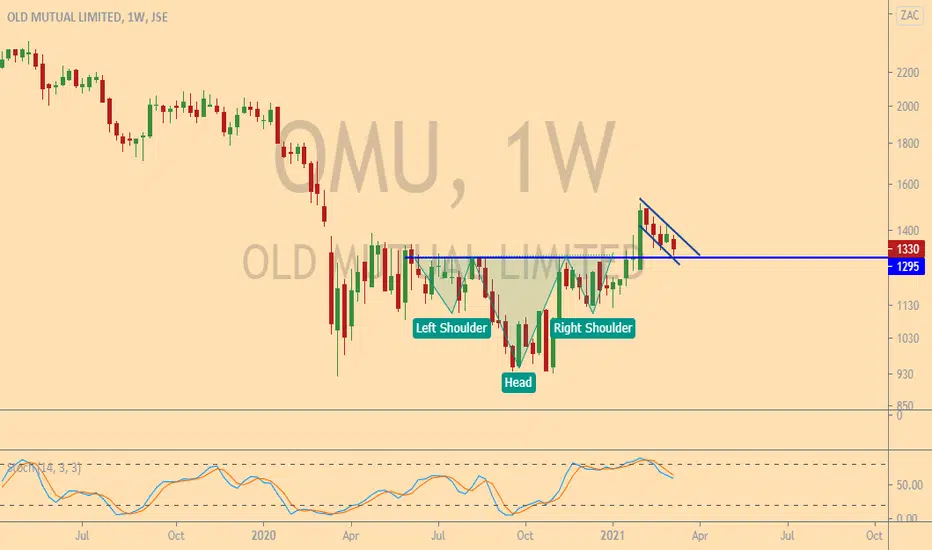
JSE-OMU: H&S (D)JSE-OMU: broke the neckline on 8th Mar, came back to retest on 10th Mar but failed
My downside TP is 1166

OMU giving another opportunity to enter.OMU formed and triggered an IHS on weekly chart. Currently it is pulling back to the neckline in the form of a flag.
OML 25day triangle consolidationwaiting for a break above R14.00 for long confirmation.
Risk Reward 1:1.5


A Hunch And A Pretty Picture Show OMU Headed For 18.50When looking at OMU using the 15min, 4H and 1D charts you can tell that when it broke its resistance it meant business. Tradingview has many analysis that carefully point this out. We want to look at the W chart. Yup! The chart where one candle is an entire week. That one!
Since we are all about grand perspective, we'll be following this over time and using it as an opportunity to learn about how financial services companies (who may argue, are refusing to move with the times and honour the new rules of their markets) will fair in this new world.
This chart illustrates an inverted head-and-shoulders:
showing entry above 13.00,
a stop loss level around 11.25 and
a possible take profit at 16.50.
But for the purposes of this watching exercise we are more interested in the ledge created between late January 2020 and mid February 2020 of 17.99. We believe OMU will continue to rise, it will beat those ledge levels and kiss 18.50 - possibly riding those level for a while before falling again.

Old Mutual - Upward Continuation?JSE:OMU broke the significant resistance level of 1350 yesterday, which it has ben struggling with since about April 2020. It is showing some nice bullish momentum and I think we can possibly be looking at a move up to around the 1650 level and possibly beyond in the longer term.

OLD MUTUAL - Bullish long term- This chart continues to develop and ticks all the boxes for a long term hold.
- 200 day moving average is starting to turn up
- R13.50 will be the next level to claim to open up a move towards R14.85
Original observation in the link attached
-- MANAGE YOUR RISK - -
Disclaimer: All ideas are my opinion and should not be taken as financial advice.
