Looks like a nice long hereThat's what she said! HA! jk. I am getting Wyckoff accumulation vibes on this one. It is very volatile so be careful. Let's see how the rest of the year plays out.
2SV trade ideas

Quantum's ZIM Trading Guide 4/8/25
NYSE:ZIM
(ZIM Integrated Shipping Services Ltd.) - Sector: Industrials (Shipping)
Sentiment:
--Bearish (slight softening). Pre-market put volume softened, RSI likely ~35 (down from ~38 with a -2.8% drop from $12.9608 to $12.591), X posts overnight mixed—tariff fears dominate, but LNG fleet news (10 new 11,500 TEU vessels announced April 8) offers faint hope, suggesting a less aggressive sell-off than March’s lows.
Tariff Impact:
--Severe. 10% universal tariffs raise fuel and container costs, with 46% Vietnam tariffs threatening Asia-U.S. routes (70%+ revenue). Sentiment overshadows fundamentals, though LNG fleet modernization and freight rate resilience provide a slight buffer.
News/Catalysts:
--Consumer Credit (April 8) could signal trade demand—weak data may deepen ZIM’s slide; X posts on the $2.3B LNG charter deal (announced April 8) and potential freight rate stabilization (e.g., Red Sea tensions) might spark a relief rally today.
Technical Setup:
--Weekly Chart:
---HVN near $15 as resistance (March 25 high: $15.2512), weekly low ~$12.4106 as support
---Downtrend (8-week EMA < 13-week < 48-week, reflecting $12–$20 range since March).
---RSI ~35 (weakening, near oversold),
---MACD below signal (histogram narrowing),
---Bollinger Bands at lower band,
---Donchian Channels below midline,
---Williams %R -80 (oversold).
-One-Hour Chart:
---Support at $12.81 (April 7 prev. close proxy), resistance at $13.547 (April 7 high), weekly confluence.
---RSI ~37, MACD below signal (histogram less negative),
---Bollinger Bands at lower band,
--- Donchian Channels below midline,
---Williams %R -78 (easing from oversold).
-10-Minute Chart:
---Pre-market drop to $12.591, 8/13/48 EMAs down, RSI ~35, MACD flat near zero.
Options Data:
--GEX: Bearish (softening)—pinning near $12.9608 eases pre-market, dealers less aggressive.
--DEX: Bearish—put delta leads but with reduced intensity.
--IV: High—~55–60% vs. norm 45–50%, reflecting tariff-driven volatility.
--OI: Put-heavy—OI concentrated below $13, capping upside momentum.
Directional Bias: Bearish (softening). GEX’s fading pinning reduces downside lock, DEX’s put delta sustains selling but softens, high IV supports volatility without sharp drops, and put-heavy OI anchors lower—bearish with less conviction.
Sympathy Plays:
--SBLK (Star Bulk Carriers): Falls if ZIM dumps (shipping correlation), rises if ZIM rebounds.
--MATX (Matson, Inc.): Drops with ZIM downside, gains if ZIM recovers.
--Opposite Mover: ZIM dumps → defensives like KO rally; ZIM rallies → SBLK/MATX surge.
Sector Positioning with RRG:
--Sector: Industrials (Shipping)
---RRG Position: Lagging Quadrant (slight improvement). ZIM’s pre-market softening from $12.9608 eases its lag vs. XLI, buoyed by LNG news.
Targets: Bullish +4% ($13.50, hourly resistance); Bearish -5% ($12.00, near April low).

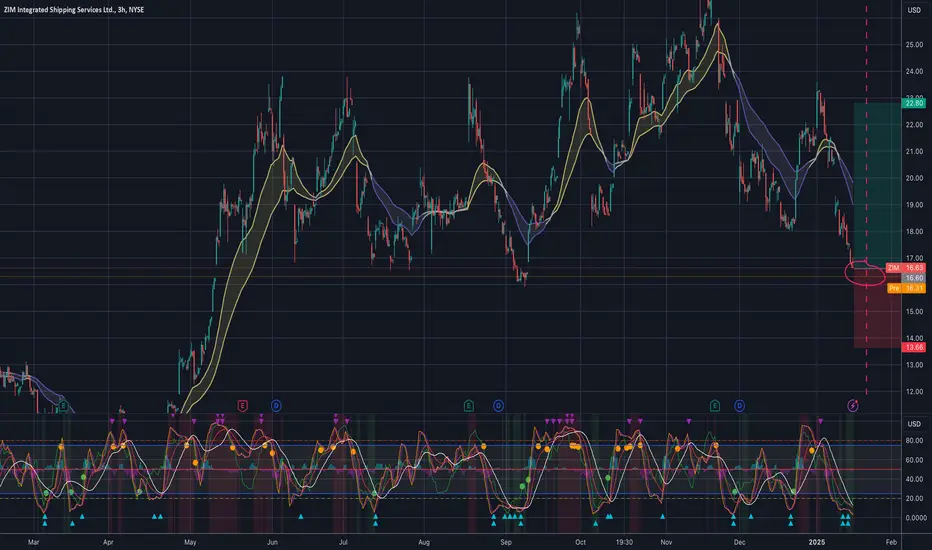
is this Max Fear for Zim? zones to watch but i Bought in $14.78ZIM’s current daily chart indicates that the stock is testing critical support around the $14.80 level after a recent bearish price action, down approximately 4.33% at the last close. The JP Momentum Stochastic DeMark indicator (bottom pane) clearly illustrates deeply oversold conditions, with multiple blue triangles signalling potential short-term trend exhaustion and a probable bounce or consolidation from current levels.
However, the current ADX reading at 21.1 remains weak, - and this is what worries me - suggesting limited momentum and no strong directional trend strength yet.
Combining this with broader research, ZIM faces macroeconomic headwinds such as anticipated oversupply in container shipping capacity, tariff-driven uncertainty, and lower projected earnings for 2025. These fundamental factors provide context to recent bearish technical action and caution traders against expecting aggressive or prolonged upward moves without positive macro or industry catalysts.
My Short, Near, and Long-Term Outlook - this is why you're here.
Short-term (1-2 weeks): Technically oversold conditions strongly favour a bounce or consolidation in the immediate term. A rebound target around $16.00–$16.50 (recent breakdown area and initial resistance) is plausible.
Confidence: 7/10 (moderate-high, due to clear oversold signals on stochastic indicators).
Near-term (1-3 months): Expect sideways volatility within a range between current support at $14.50–$15.00 and resistance at $17.50–$18.50. Persistent bearish bias (DMI Bearish, 20.1% trend strength) limits upside potential without supportive fundamental shifts.
Confidence: 6/10 (moderate; macro headwinds temper confidence).
Long-term (6-12 months): Potential gradual recovery towards $19–$22, contingent upon improving global macroeconomic conditions, stabilisation in shipping demand/supply dynamics, and resolution or easing of trade tensions.
Confidence: 5/10 (moderate-low, due to macroeconomic uncertainties and tariff risk exposure).

ZIM dips into Oversold 3H - Pivot for a Ride up or more Down?Key Technical Levels and Indicators
Current Price Range: Mid– SWB:16S
Immediate Support: $14.80–$15.20
Deeper Support: $12–$13
Near‐Term Resistance: $18–$19 (coinciding with short‐term moving averages)
Higher Resistance: $20–$22 (major zone from recent swings)
On the daily timeframe, ZIM has:
1. Broken below its short‐term moving averages.
2. Momentum turning mildly bearish on oscillators (including StochDeMarker).
3. A downward price swing from the FWB:20S into the mid‐teens, suggesting near‐term pressure.
Bearish Breakdown
• Scenario: ZIM fails to hold support around $15 and decisively closes below $14.80. This opens a path to retest $12–$13 or potentially lower if market sentiment worsens.
• Catalysts: Continued weakness in shipping rates, soft earnings or guidance, general market downturn.
• Probability: ~45%
• Time Horizon: 2–8 weeks (if the downward momentum continues)
or...
Range/Consolidation
• Scenario: ZIM finds some buying interest around $15, stabilizes, and oscillates between $15 and $18. The market awaits clearer signals from macro data or shipping fundamentals.
• Catalysts: Mixed or neutral container freight data, no major negative surprises on earnings, overall sideways movement in equities.
• Probability: ~35%
• Time Horizon: Could persist for a few weeks to a couple of months if no strong catalyst appears
Bullish Reversal/Bounce
• Scenario: ZIM stages a sharp rebound off the $15 region and pushes through $18–$19. A reclaim of $20 or more signals a short‐term uptrend.
• Catalysts: Positive shipping rate surprises, strong earnings beat, bullish macro sentiment (e.g., dovish Fed hints or positive global trade data).
• Probability: ~20%
• Time Horizon: Could happen swiftly (days to a few weeks) if a strong catalyst appears, but less likely given current downside momentum
ZIM - What is the next move? Is it in Dip?Hello Everyone,
Looks like ZIM has in down trend for a while and now again it reach to support level again yesterday. This is the 3rd touch of this level.
Now there is a 2 option for it: follow to A or B.
If support works then first target is 19,90 - 20.00 $
If not then main target level is 8.00- 8,25 $ for me.
I am keeping positive. Lets monitor for today and next week.
Have a lovely weekend to all.
Tolga

$ZIM has 50-100% Upside from $20- This is a shipping company in Israel whose fundamentals are getting stronger.
- It has 3500+ employees as per linkedin.
- It's trading at P/E of 1.82
- Stock based compensation isn't the issue has outstanding shares have remained stable for last 4 years.
- Trump in office will lead to stability in the middle east and high probability of negotiation and ceasefire.
- There are lot of tailwinds to push this company's stock higher.
- Discounted cash flow analysis estimates a fair value of $66.11, indicating the stock may be undervalued.
- Using Peter Lynch's valuation method, calculates a fair value of $298.57, implying significant undervaluation.

ZIM for longbouncing off the 40 average on the weekly chart and in a purchase block located in the 19 area

ZIM quick trade with a tight stopNYSE:ZIM traded in a range for the past five months and is now ready to march forward. Long to target levels shown on the chart, stoploss daily close below 22.5$
PS. Not financial advice, my view only!

ZIM intergrated shipping china. 24hr potterboxes.ZIM Intergrated shipping china. ticker ZIM. It closed on cost basis as you can see. friday oct 4. Cost basis is the middle line.
$19.01 is cost basis. $16.09 would be a good stop loss for a play to the up side which might just happen because it closed on cost basis. If it opens and goes to the down side. my first target would be around $17.50 second target would be $16.05 third target. if it goes this far will be around $14.40 it should take about
play to the upside would be open on $19.01 and hold that to the upside. first target $19.90 second target $20.16 third target $20.75 and then 21.98 as we should hopefully push thru this litle bit of resistance back in may thru august. well this is my take on the situation. about 15 days on the play. play it as you may. educational purposes only, not sound financial advise. Have a good day.

ZIM Short PositionThe trade signal for ZIM Integrated Shipping Services suggests a short position at $23.57, targeting $19.43 with a stop-loss at $24.61. The resistance at $23.59 has been tested multiple times, making it a strong reversal point. The target is set just above the $16.99 support level to capture profits without risking a full drop, while the risk-reward ratio of 3.94 offers an attractive setup. Recent market fluctuations and concerns in the container shipping sector could fuel a short-term correction, making this a favorable short trade.

ZIM | ZIM Integrated Shipping Good volume in the last two days.
ZIM Integrated Shipping Services Ltd. engages in the provision of shipping and logistics services. It offers shipping solutions, including the transportation of out-of-gauge cargo, refrigerated cargo, and dangerous and hazardous cargo. The company was founded on June 7, 1945 and is headquartered in Haifa, Israel.

ZIM Stock Soars 16% on Strong Q2 Results and Raised GuidanceZim Integrated Shipping Services Ltd. (NYSE: NYSE:ZIM ) made headlines with a significant surge in its stock price, jumping over 16% in premarket trading following an impressive fiscal second-quarter performance. The Israel-based shipping giant not only surpassed Wall Street expectations but also raised its full-year guidance, signaling continued confidence in its strategic direction despite broader economic concerns.
Strong Q2 Performance Fuels Investor Confidence
In its Q2 earnings report, ZIM posted a net income of $373 million on revenue of $1.93 billion. This translates to earnings per share (EPS) of $3.08, which significantly outperformed analysts’ estimates of $1.92 per share on $1.78 billion in revenue. The strong results were primarily driven by an 11% year-over-year growth in volume, a positive indicator for the company amidst global economic challenges.
ZIM’s quarterly net income of $373 million is particularly noteworthy, considering the company reported a net loss of $213 million in the same quarter last year. This dramatic turnaround highlights the effectiveness of ZIM's strategic initiatives, including cost structure improvements and capacity expansion.
Raised Full-Year Guidance: A Vote of Confidence
One of the key drivers behind ZIM’s stock rally is the company’s decision to raise its full-year guidance. NYSE:ZIM now expects its adjusted EBITDA for 2024 to range between $2.6 billion and $3.0 billion, up from its previous forecast. This upward revision reflects management’s confidence in the company’s market position and strategic execution.
CEO Eli Glickman attributed the success to “outstanding strategic execution,” emphasizing the importance of improving cost structures and expanding capacity. Glickman also highlighted positive demand trends and ongoing supply pressures stemming from geopolitical issues, such as the Red Sea crisis, which are expected to bolster the company’s performance in the second half of the year.
Adding to investor optimism, NYSE:ZIM announced a dividend of 93 cents per share, representing a 48% year-over-year increase in revenue. This move underscores the company’s commitment to returning capital to shareholders.
Technical Analysis: Momentum and Caution
ZIM's stock has gained significant momentum, with the recent earnings report serving as a catalyst for a sharp price increase. Prior to the earnings release, ZIM’s stock had dropped 8% from its year-to-date high, but strong Q2 results have rekindled investor interest. Currently, ZIM stock is up 19% and has a bullish Relative Strength Index (RSI) of 69.68, nearing overbought territory.
The daily price chart shows a gap-up pattern that may be filled in upcoming trading sessions.
The stock's 50-day moving average price is currently at $1.30, while the 200-day moving average stands at $1.49. The stock’s recent surge has pushed it above both moving averages, a bullish signal that indicates potential for further upside.
However, it’s important to note that ZIM's stock remains volatile, with significant swings in response to market news. While the stock’s RSI (Relative Strength Index) is not yet in overbought territory, investors should remain cautious as the stock approaches key resistance levels. The current beta of 1.78 also suggests that the stock is more volatile than the broader market, making it susceptible to larger-than-average price movements.
Is It Too Late to Invest in ZIM?
Despite the recent rally, the investment community remains divided on ZIM’s long-term prospects. Before the earnings release, Wall Street had a consensus “hold” rating on the stock, with an average price target just above $18, indicating a potential downside of nearly 17% from current levels. However, with the stock now trading at $23.77, some analysts see room for further gains, particularly if the company continues to execute its strategic initiatives effectively.
ZIM's raised guidance and strong Q2 performance have certainly reinvigorated investor confidence. However, with economic uncertainties still looming, potential investors should carefully weigh the risks before jumping in.
Conclusion: A Promising but Volatile Investment
ZIM Integrated Shipping Services Ltd. has delivered a strong second quarter, highlighted by impressive earnings, raised guidance, and strategic execution. While the stock’s recent surge is promising, it also reflects the inherent volatility and risks associated with the shipping industry and the broader market. Investors should consider both the technical indicators and fundamental strengths before making any investment decisions.

Anticipating a Low in ZIM, Headed Higher Through 24Anticipating the completion of wave {iv} of 3 before ZIM continues its journey higher through 23.78 and towards the 30-40 range in wave {v} of 3.
Current price levels make a good candidate for a bottom for wave {iv} of 3. Ideal Fibonacci proportion exists where wave {iv} of 3 equals 0.382 the distance of wave {iii} of 3 and wave (c) of {iv} equals wave (a) of {iv} around the bottom of the wave {iv} of 3 corrective channel at 16.80-17.00.
The guideline of alternation also comes into play between the corrective waves {ii} and {iv}. The guideline of alternation states that within an impulse wave, when wave two occurs as a sharp correction (zigzag, double/triple zigzag), expect wave four to develop as a sideways correction (flat, triangle, or combination). Here we can see that wave {ii} has developed as a zigzag and now wave {iv} appears to be developing as a flat, textbook wave behavior.
If price has any lower to go, it should be contained by the wave {i}-{ii} base channel around 14.50-15.00 and ultimately should not violate the wave {i} high of 11.50 as that would invalidate the pattern.
An impulsive reversal through 18.54 would be the first step to confirming that wave {iv} of 3 is complete and wave {v} of 3 is in progress towards and through 23.78.

ZIMTook off the table 50% of my position. First asset in the portfolio, that delivered such a move. A good start.
This was a great entry from the 1-2 1-2 fractal from both EWA structure and a simple breakout TA approach.

World Container Index Rises Drewry’s World Container Index inched up 1% to $5,901 per 40ft container this week. The Index was at $2, 846 at the beginning of Q2. Revenue should be substantially higher in Q2 and will also likely mean a continuation in Q3.

ZIM Integrated Shipping Services Options Ahead of EarningsIf you haven`t sold ZIM before the previous earnings:
Then analyzing the options chain and the chart patterns of ZIM Integrated Shipping Service prior to the earnings report this week,
I would consider purchasing the 17.5usd strike price in the money Calls with
an expiration date of 2024-10-18,
for a premium of approximately $3.75.
If these options prove to be profitable prior to the earnings release, I would sell at least half of them.

ZIM - Classic B Wave SetupPenny Man Here lads.
As you know, CitiGroup downgraded ZIM to a sell rating, causing price to cascade in a massive onslaught closing almost 20% down in a single trading day. Looking for a B-Wave setup,.
NOT going long on the expected come-up for the B wave.
I do plan on buying some short-term puts that are OTM. Probably give them 1-2 weeks time with the strike price at the bottom of the initial A wave ($19.00)
Monitoring it as it goes for Monday!

ZIM | Starting to Look for Entry pointsZIM Integrated Shipping Services Ltd. engages in the provision of shipping and logistics services. It offers shipping solutions, including the transportation of out-of-gauge cargo, refrigerated cargo, and dangerous and hazardous cargo. The company was founded on June 7, 1945 and is headquartered in Haifa, Israel.

$ZIM Long Entry for Q3My last ZIM post in Jan is currently up 100% from $10 and currently sitting at $21 so why post a new entry? Because of ZIM ZEX www.zim.com
ZIM had a bad Q2 but covered enough ground to bring back the dividend, which only adds to this long-term position but if you missed that is why I am posting.
The freight market has changed over the last 3 weeks from shippers looking for the cheapest possible rate to not being able to find capacity at 200% higher rates. With that said the carriers all announced premium rates, which I could go on and on about but in short premium rates are an offer of some level for guaranteed service at a rate much higher than the current market rate. (MSC Diamond tier service, ZIM ZEX, YML premium, etc.) The reason this is so important is the carriers are governed by the FMC to announce increases to rates 30 days in advance through "GRI" or "PSS" increases... these premium service offerings circumvent the FMC as they are only used by someone who "wants" aka needs to get their freight. Long story long.. the carriers are about to see covid style profits using the same game plan they implemented in 2021/2022 where ZIM saw a high of $90+
I am not saying it will go that high again but what I can say is that the market has shifted and for the time being the trend is supporting shippers needing to use the premiums, which are 100% higher than the market rate and the market rate is 200% higher than where it was when ZIM was $10/share.
As always in my posts here I try to cover the tenets of my strategy so here is what I am thinking on all points.
Price: The price has already ran up over 100% in the last quarter so it is definitely over-extended and likely due for a pullback but as you can see from 2021-2022 it can go extended for a long time before pulling back. That said, any dips are for me buying and will be adding to my position until the market changes.
Timeline: I will post here if the market shifts but I think ZIM sees a huge Q3 and probably Q4 but will be watching for liquidity issues and election sway for exiting this one.
Indicators: As I mentioned the price is up almost 200% from the low in Q4-2023 so the daily is over-extended on MACD and RSI but weekly and monthly look great so HTF it could just keep going. The responsible thing to do is look for a dip to key level ($15, $20, etc) but I will continue to layer into the position until something changes in the industry.
Macro: Liquidity strains due to tax season are over and
- Treasury buybacks
- QT taper
- Powell dovish AF
- Domestic liquidity tax drag mostly over
- Global liquidity looking positive BOJ/PBOC/ECB/etc.
Other trades: as freight rates rise, carrier profitability rises, and is a leading indicator for US domestic trucking which has been in a recession for 12 + months. There will be value in strong trucking stocks for Q3 and Q4 and when we exit ZIM it will be a sign to get ready to exit those. Will post any good ones I find here.

ZIM - Setting Up NicelyShipping stocks been in favour recently.
ZIM is setting up nicely, I would like it to rest for this week and early next week would love to a break on huge volume. It is being bought up on any down bars.
Might happen today as well so keenly monitoring this stock.

$ZIM retracement and then 🚀🌕 NYSE:ZIM has gone squeezed over $18 in the last week and is now in overbought zone.
I expect it to retract to around $13.5 and that after the earnings and the new guidance to shoot back over $25

ZIM: Crown PatternFundamentals:
high dividend
Earnings report projection seems positive.
Sales has been accelerating and expected sales and earnings going in to the second quarter and third quarter should be positive.
This company is cyclical and is affected by freight prices. So, something like FREIGHTOS BALTIC INDEX (FBX): GLOBAL CONTAINER FREIGHT INDEX at freightos.com is something to monitor; or Worldwide Container Index: www.drewry.co.uk
If freight prices go up, then this is good for the company. If they are relatively stable, that is ok too.
Technicals:
Weekly d3 volume w/ doji bar
Weekly NR4/7 bar
61.85 fib support
uHd on weekly MACD histogram
Weekly Crown with good volume.
Comment: I would like it if the price moved back above the weekly kijun. Below that invalidates the Crown.
Daily:
hit daily a-b-c completion area which is also the weekly 61.8% fib support area (confluence).
Comment: If this is the bottom and prices begin to rise, then I project 18 or 20 by August 2024 if it does not consolidate before that. If the stock prices do rise to 18 or 20, then it would be good to hold just for the dividend yield alone if it consolidates.

$ZIM bullish ideaNYSE:ZIM has a bullish setup, both technically and fundamentally with the shipping disruptions
