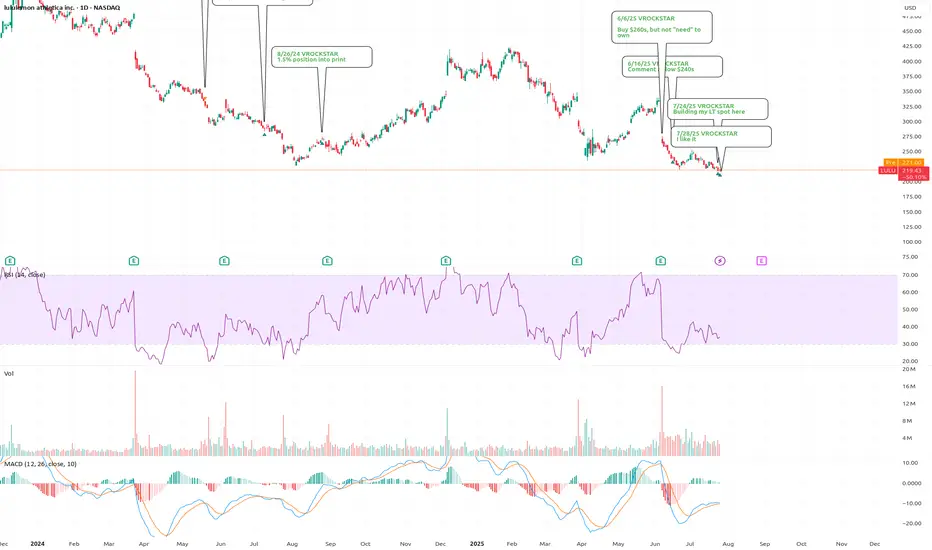
7/28/25 - $lulu - and goodbye7/28/25 :: VROCKSTAR :: NASDAQ:LULU
I like it
Apparently i can't post my thoughts anymore w/o it being flagged. so what's the point?
And i don't play stupid games and win stupid prizes... so goodbye public notes. ez decision.
Also... purely technical analysis will go the way of AI. So beware. Lea
Next report date
—
Report period
—
EPS estimate
—
Revenue estimate
—
12.96 EUR
1.75 B EUR
10.22 B EUR
104.43 M
About lululemon athletica
Sector
Industry
CEO
Calvin R. McDonald
Website
Headquarters
Vancouver
Founded
1998
FIGI
BBG000RTY6N0
lululemon athletica, Inc. engages in the business of designing, distributing, and retailing technical athletic apparel, footwear, and accessories. It operates through the following segments: Company-Operated Stores, Direct to Consumer, and Other. The company was founded by Dennis James Wilson in 1998 and is headquartered in Vancouver, Canada.
Related stocks
Yoga Pants, Tariffs, and Upside: The $LULU BetLululemon NASDAQ:LULU - My Investment Thesis 👖
Hey team,
I've been keeping an eye on NASDAQ:LULU for a while, and I'm finally going to pull the trigger.
In this market of overhyped MAG 7 stocks, Lululemon dropped 62% since its high in Dec. 2023 until now.
Here's why I'm into LULU:
Revenu

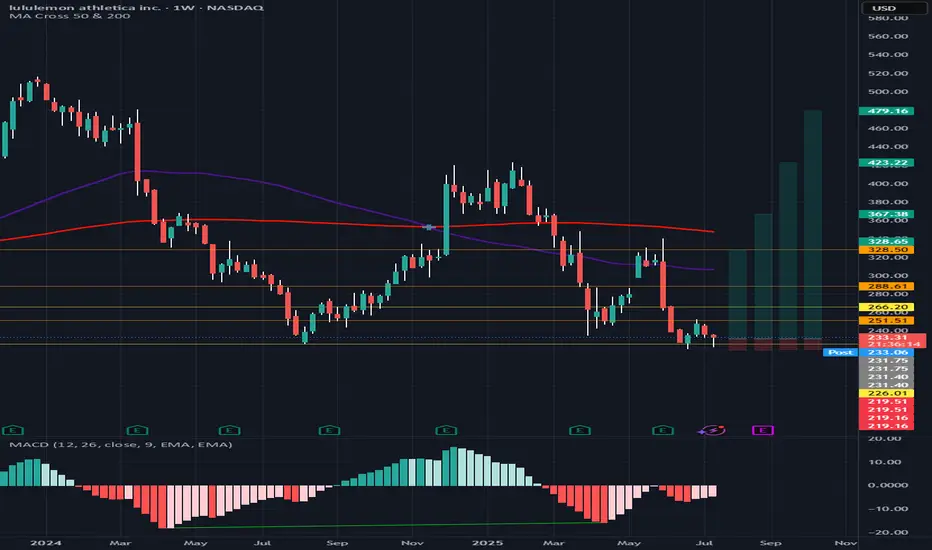
LULU into supportLulu is on sale as its just come into an area it has only sold at, 3 other times out of the past 5 years. As you can see by the Orange line, LULU has been holding this area of support for the past 5 years. This is a great buying opportunity. A close below the line on a weekly basis would stop out of

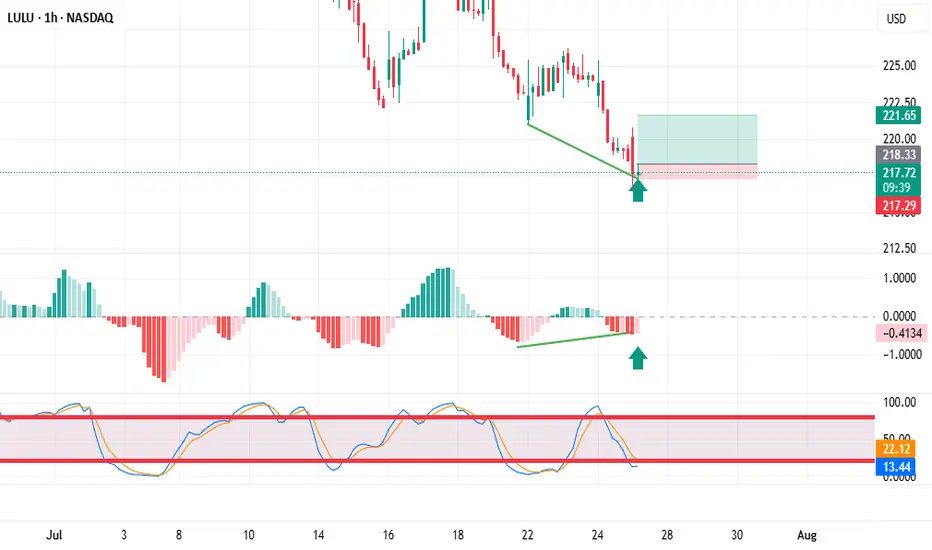
Trading stocks using Dr. Elder's "Three Screen Method"The first thing I do is check the weekly chart. Here I see excellent price divergence relative to the MACD indicator
Then I switched to the daily chart and saw the same excellent divergence as on the weekly chart.
The hourly chart also showed excellent divergence. placed a pending buy order
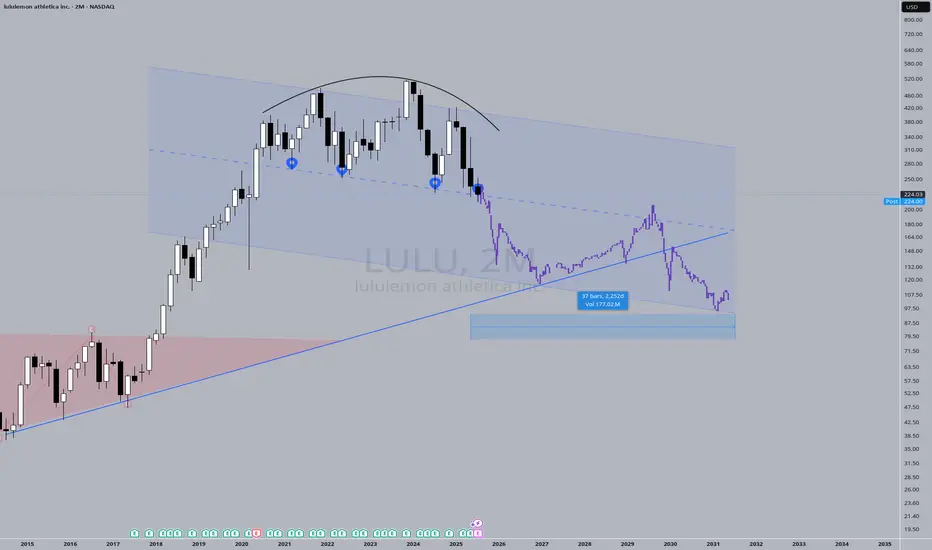
Mega-ultra macro LULU takePrice action has "knocked" on the support door FOUR times. It's got to give sometime soon. Fashion brands come and go, I think LULU has had it's time to shine, now it's time for another brand to emerge and take its place.
I say "Mega-ultra macro" to recognize the absurdity of a 6-year guess. The pr
LULU Weekly Bearish Setup – 7/21/2025
📉 LULU Weekly Bearish Setup – 7/21/2025
💥 RSI Breakdown | 📉 Institutional Bearish Flow | 💰 Premium Risk-Reward
⸻
🧠 Multi-Model Consensus Summary
🟥 RSI: Daily 36.1 / Weekly 29.9 – Bearish Momentum Confirmed
📉 Volume: Consistent sell pressure across models
📊 Options Flow: Mixed signals, but bearis

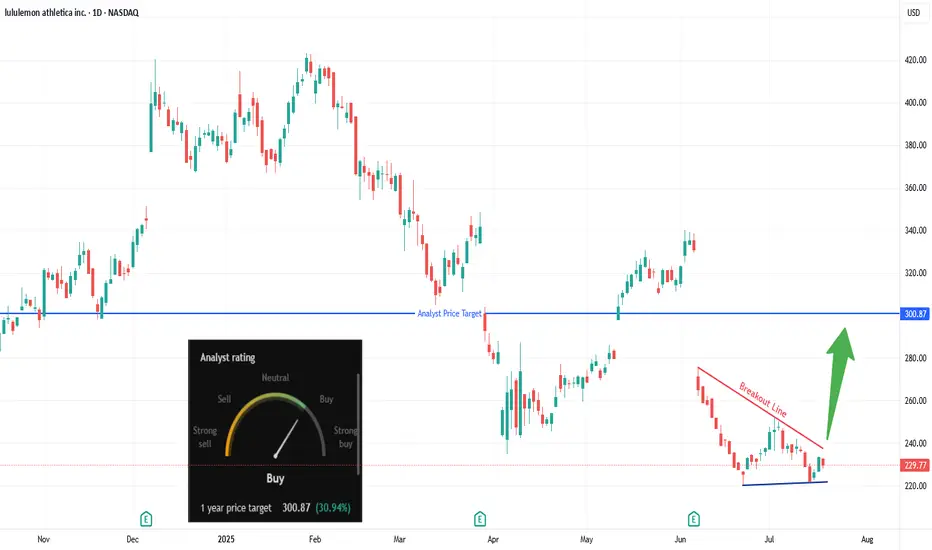
Are Bulls Quietly Loading Up on LULU?Trade Summary 📝
Setup: Descending wedge forming after sharp drop; price testing breakout line.
Entry: Above $240.
Stop‑loss: Below $220 swing low/support.
Targets: $260 , $293–$301 (analyst target).
Risk/Reward: ~3:1 (tight stop, multi-level upside).
Technical Rationale 🔍
Ke
Going to HonoLULULululemon shares fell almost 20% after the company warned tariffs and consumer caution would hurt profits.
Here are some of my bold statements about this:
Tariffs are sector-wide, not Lululemon-specific
Nearly all premium athletic and apparel brands—Nike, Adidas, Under Armour, VF Corp (The

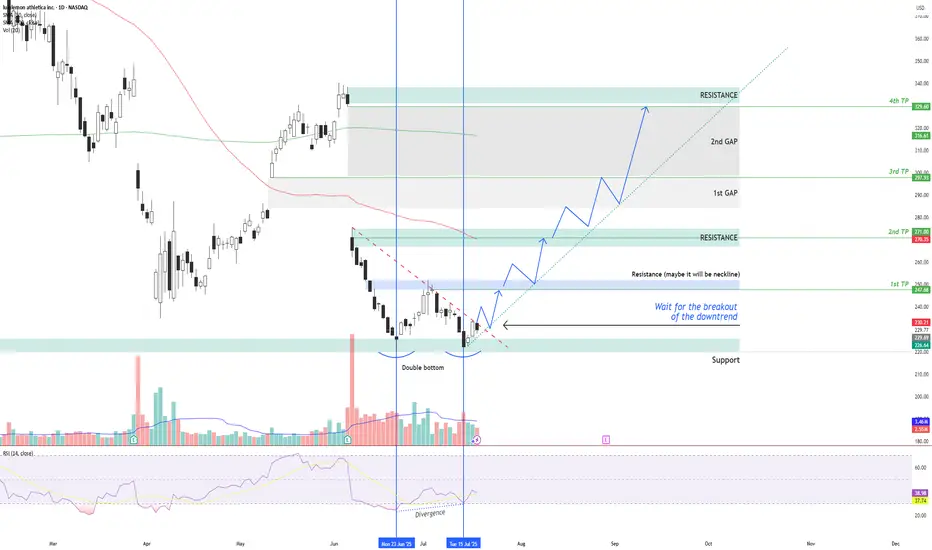
LULU – Double Bottom + RSI Divergence: Multi-Target Setup After LULU NASDAQ:LULU is showing signs of a potential bullish reversal after forming a double bottom structure around the $220 support zone , along with a bullish divergence on the RSI indicator.
Two vertical lines highlight the divergence: while price made a lower low, RSI formed a higher lo
LULU bullyou see it, we all see it. triple bottom with class A divergence and clear TP and SL, good luck!
See all ideas
Summarizing what the indicators are suggesting.
Neutral
SellBuy
Strong sellStrong buy
Strong sellSellNeutralBuyStrong buy
Neutral
SellBuy
Strong sellStrong buy
Strong sellSellNeutralBuyStrong buy
Neutral
SellBuy
Strong sellStrong buy
Strong sellSellNeutralBuyStrong buy
An aggregate view of professional's ratings.
Neutral
SellBuy
Strong sellStrong buy
Strong sellSellNeutralBuyStrong buy
Neutral
SellBuy
Strong sellStrong buy
Strong sellSellNeutralBuyStrong buy
Neutral
SellBuy
Strong sellStrong buy
Strong sellSellNeutralBuyStrong buy
Displays a symbol's price movements over previous years to identify recurring trends.
Curated watchlists where 33L is featured.

Frequently Asked Questions
The current price of 33L is 168.00 EUR — it has decreased by −6.64% in the past 24 hours. Watch LULULEMON ATHLETICA INC. stock price performance more closely on the chart.
Depending on the exchange, the stock ticker may vary. For instance, on FWB exchange LULULEMON ATHLETICA INC. stocks are traded under the ticker 33L.
33L stock has fallen by −9.88% compared to the previous week, the month change is a −19.39% fall, over the last year LULULEMON ATHLETICA INC. has showed a −30.01% decrease.
We've gathered analysts' opinions on LULULEMON ATHLETICA INC. future price: according to them, 33L price has a max estimate of 432.96 EUR and a min estimate of 134.22 EUR. Watch 33L chart and read a more detailed LULULEMON ATHLETICA INC. stock forecast: see what analysts think of LULULEMON ATHLETICA INC. and suggest that you do with its stocks.
33L stock is 7.11% volatile and has beta coefficient of 1.06. Track LULULEMON ATHLETICA INC. stock price on the chart and check out the list of the most volatile stocks — is LULULEMON ATHLETICA INC. there?
Today LULULEMON ATHLETICA INC. has the market capitalization of 20.30 B, it has decreased by −4.65% over the last week.
Yes, you can track LULULEMON ATHLETICA INC. financials in yearly and quarterly reports right on TradingView.
LULULEMON ATHLETICA INC. is going to release the next earnings report on Aug 28, 2025. Keep track of upcoming events with our Earnings Calendar.
33L earnings for the last quarter are 2.30 EUR per share, whereas the estimation was 2.28 EUR resulting in a 0.60% surprise. The estimated earnings for the next quarter are 2.52 EUR per share. See more details about LULULEMON ATHLETICA INC. earnings.
LULULEMON ATHLETICA INC. revenue for the last quarter amounts to 2.09 B EUR, despite the estimated figure of 2.08 B EUR. In the next quarter, revenue is expected to reach 2.23 B EUR.
33L net income for the last quarter is 277.77 M EUR, while the quarter before that showed 722.56 M EUR of net income which accounts for −61.56% change. Track more LULULEMON ATHLETICA INC. financial stats to get the full picture.
No, 33L doesn't pay any dividends to its shareholders. But don't worry, we've prepared a list of high-dividend stocks for you.
As of Aug 2, 2025, the company has 39 K employees. See our rating of the largest employees — is LULULEMON ATHLETICA INC. on this list?
EBITDA measures a company's operating performance, its growth signifies an improvement in the efficiency of a company. LULULEMON ATHLETICA INC. EBITDA is 2.66 B EUR, and current EBITDA margin is 27.83%. See more stats in LULULEMON ATHLETICA INC. financial statements.
Like other stocks, 33L shares are traded on stock exchanges, e.g. Nasdaq, Nyse, Euronext, and the easiest way to buy them is through an online stock broker. To do this, you need to open an account and follow a broker's procedures, then start trading. You can trade LULULEMON ATHLETICA INC. stock right from TradingView charts — choose your broker and connect to your account.
Investing in stocks requires a comprehensive research: you should carefully study all the available data, e.g. company's financials, related news, and its technical analysis. So LULULEMON ATHLETICA INC. technincal analysis shows the strong sell today, and its 1 week rating is strong sell. Since market conditions are prone to changes, it's worth looking a bit further into the future — according to the 1 month rating LULULEMON ATHLETICA INC. stock shows the sell signal. See more of LULULEMON ATHLETICA INC. technicals for a more comprehensive analysis.
If you're still not sure, try looking for inspiration in our curated watchlists.
If you're still not sure, try looking for inspiration in our curated watchlists.