ServiceNow Is Our Top Tech Compounder PickIn a tech world often driven by hype and speculation, ServiceNow NYSE:NOW stands out as a reliable growth engine—a true compounder. Unlike flashier tech names, ServiceNow delivers steady revenue growth and expanding margins, all while offering mission-critical software to businesses.
📈 What’s a Compounder, Anyway?
Compounders are companies that grow steadily over time by reinvesting profits at high returns. They may not make headlines, but they consistently outperform by:
- Growing demand for their shares
- Reducing share supply (or keeping dilution low)
These are the businesses long-term investors love: predictable, resilient, and scalable.
🧩 Why ServiceNow Fits the Bill
ServiceNow has quietly built a powerful B2B software business, helping organizations streamline operations. Here’s why it qualifies as a compounder:
Strong Revenue Growth: From $3.3B in 2020 to $11.4B today
Rapid Profit Growth: Net income jumped from $34M to $1.54B in the same period
Operating Leverage: Margins have grown from 3.4% to 13.2%, thanks to stable 80%+ gross margins and low incremental costs
Recurring subscription revenue is rising fast—up 20% YoY—driven by the mission-critical nature of its software and increasing AI capabilities.
💸 The Valuation Case
Although many quant models give NOW a weak grade for valuation, context matters. Historically, the stock is trading in the middle of its typical range—about 18x sales and 58x free cash flow.
Looking ahead:
Analysts forecast 20% annual EPS growth through 2027
That implies a forward P/E of 42x, with potential to drop further as margins expand
Combine that with AI-powered upselling and potential share buybacks, and NOW’s valuation starts to look compelling.
⚠️ Risks to Watch
Premium Price Tag: If markets decline, richly valued stocks like NOW could fall harder
Tough Competition: Rivals like Salesforce and Palantir are aggressively chasing similar markets
✅ Bottom Line
ServiceNow may not be flashy, but its financial performance, recurring revenue model, and growth runway make it a solid long-term bet. If management reins in share dilution and continues margin expansion, this stock could deliver serious compounding over the next decade.
Rating: Buy
4S0 trade ideas

ServiceNow Is Up Some 55% Since April. What Might Happen Next?ServiceNow NYSE:NOW has risen nearly 55% in the past three months as the AI-focused business-management firm and member of the S&P 500 SP:SPX gained ground ahead of and following its well-received Q1 earnings. With Q2 earnings due out later this month, what does the stock's fundamental and technical analysis say now?
Let's take a look:
ServiceNow's Fundamental Analysis
For those unfamiliar with NOW, the company sells an AI-powered platform that links clients' workers and devices to a firm's work processes and data. This helps increase productivity, improve efficiency and maximize business outcomes.
ServiceNow's cloud-based platform helps businesses digitize workflows, manage client relationships and reimagine customer experience.
The company said on Wednesday that it will report Q2 results on July 23, which could be a key date for the stock. After all, NOW rose 15.5% on heavy volume the day after management released Q1 earnings on April 23 after the bell.
As for Q2, the Street is looking for NOW to post $3.57 of adjusted earnings per share on $3.12 billion of revenue. That would compare well to the $3.13 in adjusted EPS and $2.6 billion of revenue that ServiceNow reported in the same quarter last year.
Perhaps most importantly, NOW had $10.3 billion of performance obligations as of Q1's end. That was good for 22% year-over-year growth, which bodes well for the company's future.
That said, 24 of the 35 sell-side analysts that I found who cover NOW have lowered their Q2 earnings estimates since the quarter began, while only 11 have raised their outlooks. That's typically bearish.
ServiceNow's Technical Analysis
Now let's check out NOW's chart going back to January and running through earlier this week:
image]https://www.tradingview.com/x/T9PMI1X8/
Readers will see that ServiceNow hit an $1,198.09 all-time intraday high in late January, then went into what appears to be a fairly standard "cup-with-handle" pattern from there. That's generally considered a bullish set-up.
Another bullish consideration is the so-called "golden cross" that the stock saw in late June. That's when ServiceNow's 50-day Simple Moving Average (or "SMA," marked with a blue line) crossed above the stock's 200-day SMA (denoted with a red line) at the chart's right.
Lastly, the bulls might point to a still-unfilled gap that NOW has from late January. Stocks don't always fill in such gaps, but historically, most eventually do.
However, let's now look at the other side of the coin -- the potentially bearish signals that the above chart is showing.
First, the "handle" part of NOW's "cup-with-handle" pattern has flattened out somewhat and really is rather shallow. Some technicians feel that the deeper the handle, the stronger the rally that follows. So, some might see ServiceNow's shallower handle in this pattern as not especially bullish.
Meanwhile, NOW's Relative Strength Index (the gray line at the chart's top) is neutral, but appears to be weakening.
Similarly, the stock's daily Moving Average Convergence Divergence indicator (or "MACD," marked with black and gold lines and blue bars at the chart's bottom) looks slightly bearish here.
The histogram of the ServiceNow's 9-day Exponential Moving Average (or "EMA," denoted by blue field) is below zero and has been since late May. This can typically be seen as bearish.
On top of that, the stock's 12-day EMA (the black line) and its 26-day EMA (the gold line) appear to be wrestling for the upper hand, although they both remain in positive territory.
The bulls will be rooting for the 12-day EMA to win out, while the bears will be cheering for the 26-day EMA.
Add it all up and ServiceNow looks like it's well-positioned to go ... somewhere. The question is where.
The stock's upside pivot stands at $1,046 in the chart above, having been created by the cup-with-handle pattern. That's somewhat below the $1,052.77 that ServiceNow was trading at intraday Thursday, but the stock hasn't yet held that level.
NOW's downside pivot would be its 200-day SMA (around $969 in the chart above). Losing that support line would likely force portfolio managers who are invested in the name to reduce their long-side exposure.
(Moomoo Technologies Inc. Markets Commentator Stephen “Sarge” Guilfoyle had no position in NOW at the time of writing this column.)
This article discusses technical analysis, other approaches, including fundamental analysis, may offer very different views. The examples provided are for illustrative purposes only and are not intended to be reflective of the results you can expect to achieve. Specific security charts used are for illustrative purposes only and are not a recommendation, offer to sell, or a solicitation of an offer to buy any security. Past investment performance does not indicate or guarantee future success. Returns will vary, and all investments carry risks, including loss of principal. This content is also not a research report and is not intended to serve as the basis for any investment decision. The information contained in this article does not purport to be a complete description of the securities, markets, or developments referred to in this material. Moomoo and its affiliates make no representation or warranty as to the article's adequacy, completeness, accuracy or timeliness for any particular purpose of the above content. Furthermore, there is no guarantee that any statements, estimates, price targets, opinions or forecasts provided herein will prove to be correct.
Moomoo is a financial information and trading app offered by Moomoo Technologies Inc. In the U.S., investment products and services on Moomoo are offered by Moomoo Financial Inc., Member FINRA/SIPC.
TradingView is an independent third party not affiliated with Moomoo Financial Inc., Moomoo Technologies Inc., or its affiliates. Moomoo Financial Inc. and its affiliates do not endorse, represent or warrant the completeness and accuracy of the data and information available on the TradingView platform and are not responsible for any services provided by the third-party platform.

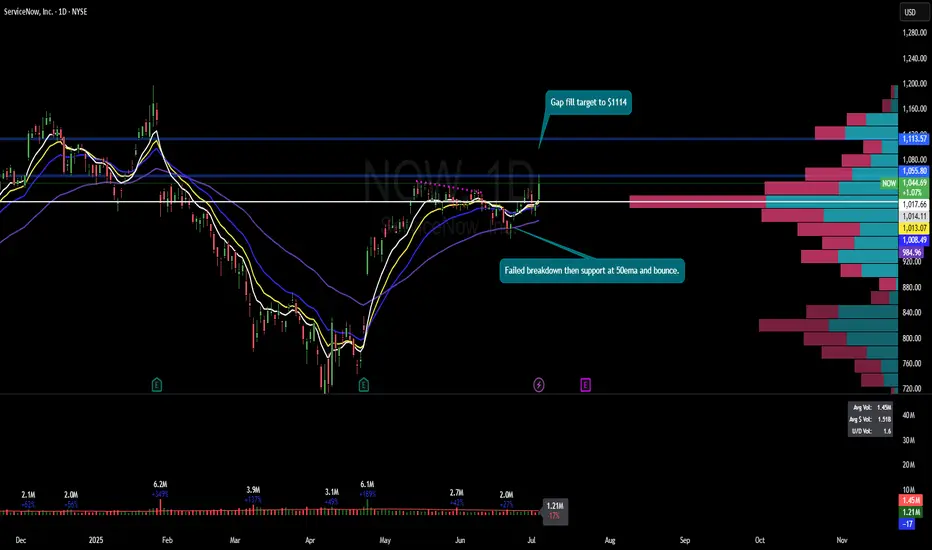
$NOW $1114 pt?NYSE:NOW had failed breakdown then bounce at 50ema on daily and it had recaptured 8ema and 21ema on daily. Gap fill target remains to $1114.
ServiceNow Has Been RestingServiceNow has been resting for months, and now some traders may think the software company is ready to move again.
The first pattern on today’s chart is the price area around $960. It was the peak in late April and the low early last month. NOW pulled back to hold that level yesterday and bounced.
Second, the 50-day simple moving average swung up to visit the stock as a hammer candlestick formed. That may reflect positive intermediate-term momentum and a halt to the short-term slide.
Third, stochastics are turning up from an oversold condition.
Finally, Bollinger Band Width recently fell to its lowest reading since 2017. Could that tight price action give way to increased movement?
Check out TradingView's The Leap competition sponsored by TradeStation.
TradeStation has, for decades, advanced the trading industry, providing access to stocks, options and futures. If you're born to trade, we could be for you. See our Overview for more.
Past performance, whether actual or indicated by historical tests of strategies, is no guarantee of future performance or success. There is a possibility that you may sustain a loss equal to or greater than your entire investment regardless of which asset class you trade (equities, options or futures); therefore, you should not invest or risk money that you cannot afford to lose. Online trading is not suitable for all investors. View the document titled Characteristics and Risks of Standardized Options at www.TradeStation.com . Before trading any asset class, customers must read the relevant risk disclosure statements on www.TradeStation.com . System access and trade placement and execution may be delayed or fail due to market volatility and volume, quote delays, system and software errors, Internet traffic, outages and other factors.
Securities and futures trading is offered to self-directed customers by TradeStation Securities, Inc., a broker-dealer registered with the Securities and Exchange Commission and a futures commission merchant licensed with the Commodity Futures Trading Commission). TradeStation Securities is a member of the Financial Industry Regulatory Authority, the National Futures Association, and a number of exchanges.
TradeStation Securities, Inc. and TradeStation Technologies, Inc. are each wholly owned subsidiaries of TradeStation Group, Inc., both operating, and providing products and services, under the TradeStation brand and trademark. When applying for, or purchasing, accounts, subscriptions, products and services, it is important that you know which company you will be dealing with. Visit www.TradeStation.com for further important information explaining what this means.

NOW watch $805: Major resistance zone to break could pop 9%NOW is testing a key resistance zone at $804.36-806.76
Break-n-Retest may easily pop to target $884.44-886.81
Stop loss is also a good distance below at $753.37-758.73

Intuition stock: NOW shortI navigate markets by using my dowsing skills, and sometimes, intuitive hits. I actually have to sit still & ask for the intuitive stocks, however, & I don't often do it - even though I've had some remarkable results.
I did take a shot this morning though & heard or received, "NOW". Unsure if it was a suggestion to be more in the moment, I cleared my mind again & still got NOW & repeatedly the number 38. I pretty much left it at that, but took a look at the chart anyway, then went on with my day. It wasn't until I decided this afternoon to ask dowsing if there's anything to it that I got really intrigued...
I asked for the most important things to know about it, and got the "crash" option, followed by, "it's a big high". So I take another look at the chart to see what the hod might have been, & then I was blown away to see it is $1037.94. That's as good as 38 to me, & this is why I'm making this idea to journal what happens because it was very clear and repeating the number 38 in my mind this morning.
I used dowsing to try for the low. I think it's about 5.7% down this week. That'll be around 976-78. And the bigger low is around $947. I asked what date that low may hit by and got a date of June 16th, but I wouldn't put too much weight in that. I can't wait to see what happens with this one. We'll see!

ServiceNow Surges 15%+ on Strong Earnings and Analyst UpgradesServiceNow (NYSE: NOW) soared 15.2% to $934.16 by late morning Thursday after releasing strong Q1 2025 results. At the same time, the S&P 500 gained 1.2% and the Nasdaq Composite rose 1.7%. The company posted adjusted earnings per share of $4.04, outperforming analysts’ forecast of $3.83. Revenue came in at $3.09 billion, meeting consensus expectations and surpassing ServiceNow’s internal guidance.
The software firm recorded a 19% year-over-year increase in revenue, mainly driven by growth in subscription sales. This segment contributed $3 billion, reflecting continued customer demand for cloud-based workflow automation services. ServiceNow also raised its full-year performance targets, signaling confidence in sustained growth throughout 2025.
The stock has rebounded sharply after recent market weakness. Its current price of $934.16 reflects renewed investor confidence as the company continues to deliver steady top- and bottom-line expansion. Volume during the session reached 7.31 million shares, well above average.
Technical Analysis
Technically, NYSE:NOW bounced from the support zone around $700, aligned with the 200-day moving average of $707.13. ServiceNow respected this level and reclaimed its 100-day ($865.17) moving average. A steep ascending trendline confirms long-term bullish momentum and support since late 2022.
The surge suggests a possible retest of the previous all-time high at $1,198.09. Price action may consolidate around the $1,000 psychological mark before advancing. Volume spikes during the rally indicate strong buying interest.
The technical setup signals a continuation of the uptrend, with bulls targeting a return to historical highs. As long as the price stays above trendline support, the horizontal support, and key moving averages, the uptrend remains intact.

Bullish momentum in $NOW! 22% Upside🔥 Bullish momentum in $NOW!
🚀 $1,126 on the horizon! 🎯
✅ Indicators curling upward
✅ Volume shelf ready to launch
✅ Wr% swinging green to red
✅ Great earning/ guidance
Big move loading—are you in? 👀
Not financial advice

NOW is back NOW bullish reversal is about to be confirmed
once it passes the 200 EMA support and close above 948 that will confirm its reversal..
Entry @ 948 ( after close a day candle above 948)
Stop loss @ 890 ( the gap up opening gap)
NOW. Going down to $500. Huge long opportunity!NOW has been super bearish. See my last chart. I will be buying at $500 for a long-term hold. Im really hoping we get down to $500 for my entry.

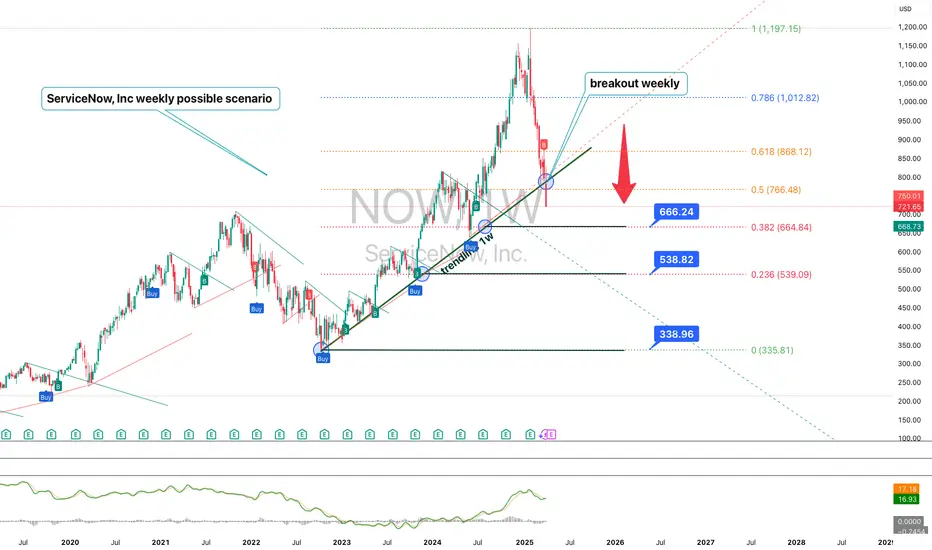
ServiceNow (NOW) – Technical and Fundamental Analysis 1WServiceNow shares have broken below a key ascending trendline on the weekly chart, strengthening the bearish outlook. The price is approaching the 666, 538, and 338 support zones, which may act as potential reversal areas. The RSI continues to decline, indicating weakening bullish momentum, while the MACD confirms a bearish crossover. EMA 50/200 suggest a rising risk of further downside.
Fundamentally, ServiceNow remains a leader in cloud-based solutions and business process automation. However, it faces pressure from rising interest rates and a possible slowdown in corporate IT spending. Valuation remains elevated, making the stock vulnerable to broader market shifts and macroeconomic headwinds. Upcoming earnings reports will be critical in determining the next move.
The main scenario suggests a drop toward 666 and 538, with a potential extension to 338. An alternative scenario would be a recovery above 766, opening the way toward 868 and 1012. A confirmed close below 666 will reinforce the bearish trend.
Stocks in Oversold areaConsidering buying NYSE:NOW NASDAQ:TTD NYSE:NVO NYSE:RDDT NASDAQ:HOOD NASDAQ:FRPT

NOW. Almost at resistance. Long term play.I expect a rejection at my projections. Might find support at the first level below the top box. I will consider a long there, but I will post a new chart once we get close to there. Would take a big position if we ever got to my bottom box.

1/29/25 - $now - Valuation is... silly >$1k1/29/25 :: VROCKSTAR :: NYSE:NOW
Valuation is... silly > MIL:1K
- 20x ev/ sales for 20% sales growth, really anon?
- participated on the B2B pump y day "the next rotation into cheaper AI benefits software" -> that's a low order of thinking though. a. obvious, b. valuation matters and c. benefits won't accrue to just the big guys -> if anything they accrue to smaller players disproportionately w/ inability to partner/ spend as much $
- but back here
- listen. great co. great chart.
- but seeing NASDAQ:MANH (a crappy NASDAQ:PLTR from what i can tell) do the crap walk into EPS, i just see scenario where any hiccup on growth sends this -10 or 15%.
- so am i short it? maybe, maybe not. it's a hedge... let's say. for my exposure on NYSE:UBER , $meta... evaluating the others tn NASDAQ:MSFT (probs sidelines for me), and $tsla... god knows - earnings there r spinning the wheel of how-lucky-do-u-feel, probs a "beat".
alas.
gl to all. but 70x PE for low 20s EPS growth, anon, you could do a lot better and stop following the guys shilling you their bags. 2% fcf yield? okay. enjoy. hope you have a nuanced view if you're long this into print and coming months. V thinks... lower
V

NOW: Bearish Signs – Harmonic Pattern Hints DeclineServiceNow (NOW): Bearish Setup Ahead of Earnings
ServiceNow (NOW) is showing signs of potential bearish movement as it nears its earnings announcement on January 29.
Bearish Divergence: Notable on both the daily and weekly charts, suggesting weakening momentum.
Double Tops Formation: A reversal pattern indicating potential selling pressure.
AB=CD Harmonic Pattern: The bearish harmonic pattern has completed, signaling a possible correction.
Key Levels to Watch:
A closing below $999 would indicate a break of structure, potentially targeting the rising trendline support.
If you’re holding positions, consider off-loading some shares at current levels and re-evaluating after the earnings announcement.
Stay vigilant and monitor price action closely. Happy trading!

Huge Earnings and Economic Surprises Ahead!🚨 Weekly Preview: Big Earnings and Economic News 🚨
Get ready for an action-packed week as we dive into major corporate earnings reports and crucial economic updates! 📊💼
🔍 Earnings Highlights:
Tech giants like Apple, Microsoft, and Tesla are set to release their quarterly results.
Also, goliaths such as Visa, Mastercard, ASML and more!
📈 Economic Indicators to Watch:
Inflation rates 📉
GDP Growth 📊
Federal Reserve policy decisions 💵
Stay tuned for in-depth analysis and insights on how these events could shape market trends and investor sentiment. Don't miss out on the key information that could impact your financial decisions! 📅📢

Drop on ServiceNow Inc on the Radar. NOWA five wave Elliott impulse appearing to be reaching conclusion. There is a cross of Ehler's Smoother, and Stochastic and volatility zone indicators have already turned. This is a less reliable picture, as the momentum only appears to be growing. It is prudent to stay mindful of the fact that no confirmatory levels have been crossed.
We are not in the business of getting every prediction right, no one ever does and that is not the aim of the game. The Fibonacci targets are highlighted in green or purple with invalidation in red. Confirmation level, where relevant, is a pink dotted, finite line.
Fibonacci goals, it is prudent to suggest, are nothing more than mere fractally evident and therefore statistically likely levels that the market will go to. Having said that, the market will always do what it wants and always has a mind of its own. Therefore, none of this is financial advice, so do your own research and rely only on your own analysis.
Professionally, we are big fans of any indicators from Jurik, De Mark and Ehlers, which we use in addendum in analysis prior to putting down positions.
We prefer a combination of at least four technical factors to favor a particular stance. A stance is never decided by this constellation, rather the constellation merely confirms the stance.
Trading is a true one man sport. No single confluence of indicators is truly good enough, and a professional trader's sense must be developed through a lot of hard work and over a significant period of time. Good luck out there and stay safe.

Pre-Market Updates: NOW Long Position PotentialThis morning, ServiceNow saw a $1.2B in volume after Baird raised its Price Target for NOW to $1,250 (from $975), maintaining their Outperforming Rating. From a technical analysis perspective, for those who may not hold this currently, now could potentially be a great opportunity to either snatch some shares or prospect some option plays.
Based on our 3-6 Month Price Projection from our TA, NOW is trending to see at least $1120 by early March - $1220 by early June, so options with expirations in March or June to be more conservative (with a lower delta) around the 1180-1200 Price Target would be sufficient.
Holding shares would get provide a potential for 10-15% increase alone by expecting NOW to at best retest that $1157 Resistance before compressing back to the lower Yellow Support Level that we've respected and used for paste price projections which were on point based on the trend. So if we stick to trend and hear some great things from Earnings on Feb 26th, 2025 showing continued guidance upwards.
Connect with us for more by visiting the links in our signature to access more tools and resources at @MyMIWallet #MyMIWallet

ServiceNow, Inc: Riding the Ascending ChannelServiceNow (NOW) has been trending upwards within a well-defined ascending channel, a bullish structure that highlights the stock's ongoing momentum. The chart showcases key support, resistance levels, and potential price targets, offering actionable insights for traders and investors.
Chart Analysis: Key Observations
Ascending Channel Dynamics
ServiceNow's price action is neatly confined within an ascending channel, with higher highs and higher lows.
The lower boundary of the channel, around $1,042, acts as strong dynamic support.
Key Resistance Levels and Targets
Target 1: $1,106
Target 2: $1,134.80
Target 3: $1,212.02
SP: $1,042
What’s your perspective on ServiceNow’s next move? Share your insights in the comments!
⚠️ Disclaimer: This blog is for educational purposes only and does not constitute financial advice. Always conduct your own research before making investment decisions.

One Good Trade: NOW is Showing Continued StrengthThe setup has everything we are looking for:
Strong bull bar > 2 standard deviations
Strong momentum on the MACD
Small pullback with a potential for an aggressive entry

Does $Now have further upside, or is it nearing a potential top?To project targets, I am using the following methods:
Cup and Handle Pattern
If we consider the price range of $709.02 - $338.24 as forming a cup and handle pattern, the price movement represents approximately a 52% increase.
Projecting this on the upside sets a target of around $1078.79, which was achieved last week.
A weekly close above $1122.44 will signal a potential next target at $1316.16, derived from the 2.61% Fibonacci extension applied to the range of $709.02 - $338.24.
Fibonacci Extensions
Using Fibonacci extensions on the same price range, the 2.61% target aligns with $1316.16 as the next significant resistance level.
Key Levels:
Support: The uptrend remains intact as long as $906 holds.
Downside Risk: If $906 is breached, the next downside target is $709.02.

$NOW looking like a perfect setup for NVDA earnings tomorrow I'm thinking this retests ~1010 level tomorrow and from there we see another leg up.

$NOW with a bullish outlook following its earnings #StocksThe PEAD projected a bullish outlook for NYSE:NOW after a positive under reaction following its earnings release placing the stock in drift A with an expected accuracy of 81.25%.
