ServiceNow: Growing Fund OwnershipFundamentals :
A strong company with increasing number of funds clamoring for its stock. I also like its sales and earnings, its strength relative to the S&P500, and its forward-looking est. growth in 2024. Return on equity is about 35%.
Technicals :
Week of Sept 25th hammer candle and Week of October 23 engulfing candle with huge volume produced a bottom. Then, a recent breakout, confirming the support.
Confluence:
a-b-c equal legs completion
uHd
Extreme Bottoming indicator
Price in double G-TAZ zone
First pb of new trend up
4S0 trade ideas

NOW short positionHi traders,
let's have a look at the NOW chart.
The price is now at the resistance and on RSI index we can see it is overbought.
We can expecting pullback and therefore we can take short position here.
Target 1 and target 2, entry price and stop loss are shown on the graph.

Earnings AMCEarnings today.
Descending triangle which is neutral until broken.
Top line slopes down and bottom line is support and virtually flat.
Rectangle, another neutral pattern, is also noted. Top line of rectangle is 614.36.
No recommendation.
ServiceNow, Inc. provides enterprise cloud computing solutions that defines, structures, consolidates, manages, and automates services for enterprises worldwide. The company operates the Now platform for workflow automation, artificial intelligence, machine learning, robotic process automation, process mining, performance analytics, electronic service catalogs and portals, configuration management systems, data benchmarking, encryption, and collaboration and development tools. It also provides information technology (IT) service management applications; IT service management product suite for enterprise’s employees, customers, and partners; strategic portfolio management product suite; IT operations management product that connects a customer’s physical and cloud-based IT infrastructure; IT asset management; and security operations that connects with internal and third party. In addition, the company offers integrated risk management product to manage risk and resilience; environmental, social and governance management product; human resources, legal, and workplace service delivery products; safe workplace suite products; customer service management product; and field service management applications. Further, it provides App Engine product; Automation Engine enables application to extend workflows; platform privacy and security product; procurement operations management suite; and professional and customer support services. The company serves government, financial services, healthcare, telecommunications, manufacturing, IT services, technology, oil and gas, education, and consumer products through direct sales team and resale partners. It has a strategic partnership with Celonis to help customers identify and prioritize processes that are suitable for automation. The company was formerly known as Service-now.com and changed its name to ServiceNow, Inc. in May 2012. The company was founded in 2004 and is headquartered in Santa Clara, California.

Stage 4 ContinuationWeinstein Stage Analysis:
NOW is currently in a stage 4 downtrend, until we see a significant change in trend then I am expecting price to continue declining. First reversal area can possibly be the 200 moving average. After that if it breaks then we may see a prolonging trend lower.

NOW ServiceNow Options Ahead of EarningsAnalyzing the options chain and the chart patterns of NOW ServiceNow prior to the earnings report this week,
I would consider purchasing the 470usd strike price Puts with
an expiration date of 2024-5-17,
for a premium of approximately $27.80.
If these options prove to be profitable prior to the earnings release, I would sell at least half of them.
Looking forward to read your opinion about it.


$NOW: Weekly and quarterly uptrendLow risk idea here, with a tight stop being feasible to enter long positions in NYSE:NOW , ahead of earnings next week. I suggest a small position, say 1 to 5% of your portfolio to be safe.
Upside target is near $1000 for the long term chart, weekly trend points to the signal target shown on chart, with the cyan box and take profit level shown.
Best of luck,
Cheers,
Ivan Labrie.

Bullish IdeaNOW had earnings the other day beating both revenue and earnings, however fell due to some fundamentals.
From a technical standpoint, VWAP suggests buyers are supporting the stock at the low price near the floor. Price looks as if it's ready to break thru the ceiling and recover some of it's lost ground from yesterday. VWAP suggests buyers are supporting it at this low price and in addition, it looks like it can break thru a few key Daily moving averages.
This is a day trade. I'm not looking to swing it, however, depending on how strong the possible move is, and from the overall market and sector sentiment, I may consider scaling down and leaving a few runners.
This is not financial advice, merely my opinion. Remember, there is no such thing as a guaranteed move!

NOW Entry, Volume, Target, StopEntry: when price clears 563.63
Volume: with daily volume greater than 1.39M
Target: 597 area
Stop: Depending on your risk tolerance; 552.52 gets you 3/1 Risk/Reward.
This swing trade idea is not trade advice and is strictly based on my ideas and technical analysis. No due diligence or fundamental analysis was performed while evaluating this trade idea. Do not take this trade based on my idea, do not follow anyone blindly, do your own analysis and due diligence. I am not a professional trader.

Head and Shoulders on NOWHead and shoulders may be in play on NOW. Likely will be valid if S&P continues to correct. Easy invalidation given the most recent candle. Looking to exit on Daily gap fill around $517.


Massive Breakout - Service Now - Price Target $1000This wide moat stock is currently undervalued and ready for a massive breakout with the arrival of the golden cross.
Price target is >$1000 within the next 12 months.

NOW with a bearish outlook following its earnings #StocksThe PEAD projected a bearish outlook for NOW after a negative over reaction following its earnings release placing the stock in drift C with an expected accuracy of 33.33%.

NOW-SELL strategyNOW is overbought and has formed a "hammer top".
Strategy is SELL current @ $ 510 and take profit near $ 472. Stop-loss only if desired @ $ 535 (financial).

NOW-SELL strategyThe stock is overbought and it's in a too steep angle above the current GANN support lline. I suspect we will see a break/correction below the support $ 495 and to correct to $ 475 GANN 1/1 support area,
Strategy is SELL @ 510 and take profit @ 478. Stop-loss should be a financial one when desired.

383 by 5/22383 by May 22nd, or as early as May 11th (best case)
Then bounce
Needs to break below 434 but move is already set in motion

NOW long opportunityThis chart had a failed bearish breakdown which usually dictates more upside.
Since it was defended at support it does favor more upside.
A clear close back below the major Pivot low should be used as a stoploss.
Personally waiting for a pullback in the indices to go long.

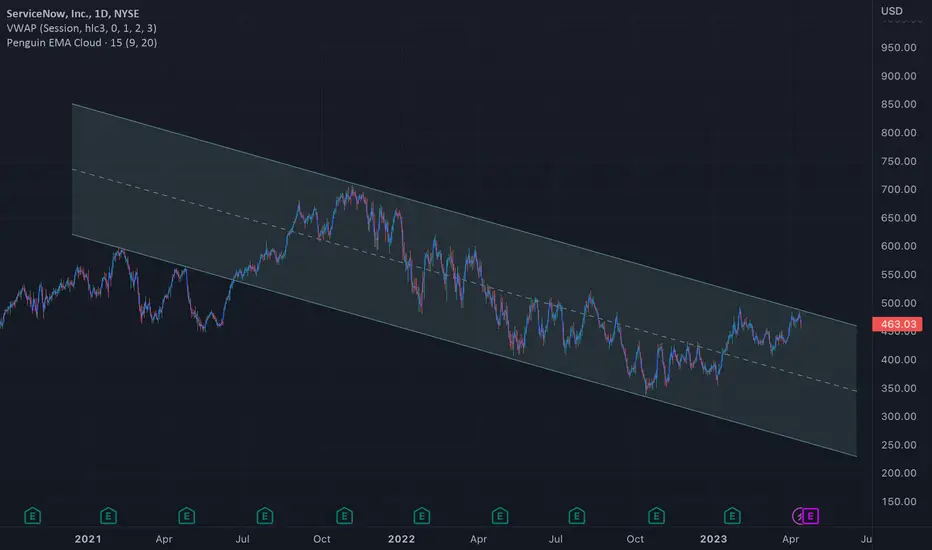
$NOW in a nice downward channelWatching NYSE:NOW this week for a short position. The second top touch of the channel was super recent so its not a super strong resistance. However considering it runs parallel with a strong underside of the channel it gives me more confidence. If we get some confirmation to the downside we have a good amount of room to the downside.
Gap fill incomingHeading down to fill 393 gap by early April. I don't see it getting above 448-450 here tomorrow and will likely start move down by end of this week.
Watch 410-415 for possible support, but shouldn't stop it from dropping to 390s.

NOW - Short SetupLooking for a break below 422.84, potential stop signal 447.63, First target 374.13. 2nd Target 163.57. Significant insider selling in December and January.

Earnings Play 10-20% UpsideExpect pop to 480s tomorrow 1/26 then continuation to 520s by Feb 10th expiration
Last chance to get in on calls
This is the greatest stock of all time

$NOW with a Bullish outlook following its earnings #Stocks The PEAD projected a Bullish outlook for $NOW after a Positive Under reaction following its earnings release placing the stock in drift A with an expected accuracy of 78.57%.

NOW📈The stock has broken the bearish phase. Limit buy placed. The risk is that the limit order only gets reached if the broken trend line is retested. But that's okay.
