The Zoom canary?We're at support, if it's an inverted head and shoulders the target is 170. This would mean that all tech stocks and most equities will likely rally soon for a few weeks. It's wrong under 92
5ZM trade ideas

Zoom: Breaking lower from a wedge formationZoom - Short Term - We look to Sell at 106.91 (stop at 126.13)
Broken out of the wedge to the downside. The medium term bias remains bearish. We have a Gap open at 106.91 from 12/07/2022 to 13/07/2022. Further downside is expected although we prefer to set shorts at our bespoke resistance levels at 106.91, resulting in improved risk/reward. Expect trading to remain mixed and volatile.
Our profit targets will be 61.07 and 50.00
Resistance: 106.91 / 124.05 / 127.37
Support: 97.09 / 79.03 / 60.97
Disclaimer – Saxo Bank Group. Please be reminded – you alone are responsible for your trading – both gains and losses. There is a very high degree of risk involved in trading. The technical analysis, like any and all indicators, strategies, columns, articles and other features accessible on/though this site (including those from Signal Centre) are for informational purposes only and should not be construed as investment advice by you. Such technical analysis are believed to be obtained from sources believed to be reliable, but not warrant their respective completeness or accuracy, or warrant any results from the use of the information. Your use of the technical analysis, as would also your use of any and all mentioned indicators, strategies, columns, articles and all other features, is entirely at your own risk and it is your sole responsibility to evaluate the accuracy, completeness and usefulness (including suitability) of the information. You should assess the risk of any trade with your financial adviser and make your own independent decision(s) regarding any tradable products which may be the subject matter of the technical analysis or any of the said indicators, strategies, columns, articles and all other features.
Please also be reminded that if despite the above, any of the said technical analysis (or any of the said indicators, strategies, columns, articles and other features accessible on/through this site) is found to be advisory or a recommendation; and not merely informational in nature, the same is in any event provided with the intention of being for general circulation and availability only. As such it is not intended to and does not form part of any offer or recommendation directed at you specifically, or have any regard to the investment objectives, financial situation or needs of yourself or any other specific person. Before committing to a trade or investment therefore, please seek advice from a financial or other professional adviser regarding the suitability of the product for you and (where available) read the relevant product offer/description documents, including the risk disclosures. If you do not wish to seek such financial advice, please still exercise your mind and consider carefully whether the product is suitable for you because you alone remain responsible for your trading – both gains and losses.

ZoomThe stock presents a pattern of change in trend (HCH) in a weekly timeframe, in addition to this, the RSI indicator is presenting increasing highs within its movements represented by an upward trend line.
We recommend buying at current prices with a stop loss at 78.80 and a take profit at 125.00 and as a second target in case the HCH projection is met, a take profit #2 at 205.00 USD per share.

$ZM with a Bearish outlook following its earnings #Stocks The PEAD projected a Bearish outlook for $ZM after a Positive over reaction following its earnings release placing the stock in drift B.

ZM ZOOM Possible Long entry targeting 2-3X closed at 99.5It may takes sometime! but compared by others ZM had different bullish RSI for a while and MFI at low levels too. bearish daily close on Friday and can go down even to 94.5-86.4-81.6-73.8 or lower which shall be good spots for long term target but again its earning move so if earning better than expected this could lead for strong bounce even for short squeez targeting 136--149-181 and if earning missed up then it will speeds falling to new bottom . So the idea is Bull long call with put protection. could be strangle too . will take this trade by next week with updated options strikes . if earning is soo good its possible close up all higher gaps with initial target between 247-273 . note this stock is falling from 588

ZM Bottom BuildingThis young company benefited greatly from the pandemic but like all of the some 100+ companies that had huge revenues in 2020 - 2021, it was not sustainable due to the artificial inflation of stock prices via stimulus checks. Since the stimulus was a manipulation of the monetary system and the financial markets, there is no way any firm could manage the situation. So the stock plummeted due to lower revenues and earnings.
Now, it is definitely building a bottom. It is not complete, and I always advise waiting for completion of a bottom because it is emotionally draining for most investors or position traders to watch the stock fall further and wait for it to recover and move up higher thereafter. It takes a lot of discipline and confidence to hold in a final run down in a bear market. So avoid the risk and wait for a completion of the bottom.
strong resistance areas! 🥵I believe we are seeing small rally due to recent increase in covid cases, short lived rally IMO.
long trigger is 128.85, im pretty bearish as long as we stay below these resistance areas though.. my downside targets are 107.23-94.87

WATCH $ZMBullish
Fundamental
- High inflationary macro environment / fear sentiment
- Earnings don't looks favorable coming quarters
- Funds Accumulation
- Decent earnings
- Decent PE
- Decent PEG
- Positive P/FCF
- Weak Sector / Industry
- Covid lock down theme ?
Technical
- Momentum Theory Indicator - Seems like bottomed and making a reversal trend momentum
- Price action formation ( falling wedge )
- Yet to break downward Trend line
- Price still below 200MA
- Price above POC
Entry idea
- Entry idea was based on few confluences
- Rejection / retest of the trend line
- Price below 200 MA
Stop loss depending on entry and risk appetite. But always set meaningful stops.
”I fear not the man who has practiced 10,000 kicks once, but I fear the man who has practiced one kick 10,000 times.”
Cheers and happy trading!

Zoom Video CommunicationsThursday, 2 July 2022
06:52 AM (WIB)
Zoom needs attention on Monday morning.


Zoom(ing) In On A Potential Pitchfork PlayIn this update we review the recent price action in Zoom and identify the next high probability trading pattern and price objectives to target

supply areathe price is rallying into a weekly (yellow) and daily (blue) supply zone and I expecting the price drop from it.

Zoom CommunicationsA buy setup after the formation of inverse head and shoulder. Wait for the break out and a retest if you want to take the trade.

Time for ZM long?Possible inverted H and S on ZM. Above all short term MAs and lets see if we close above the 100 sma today.

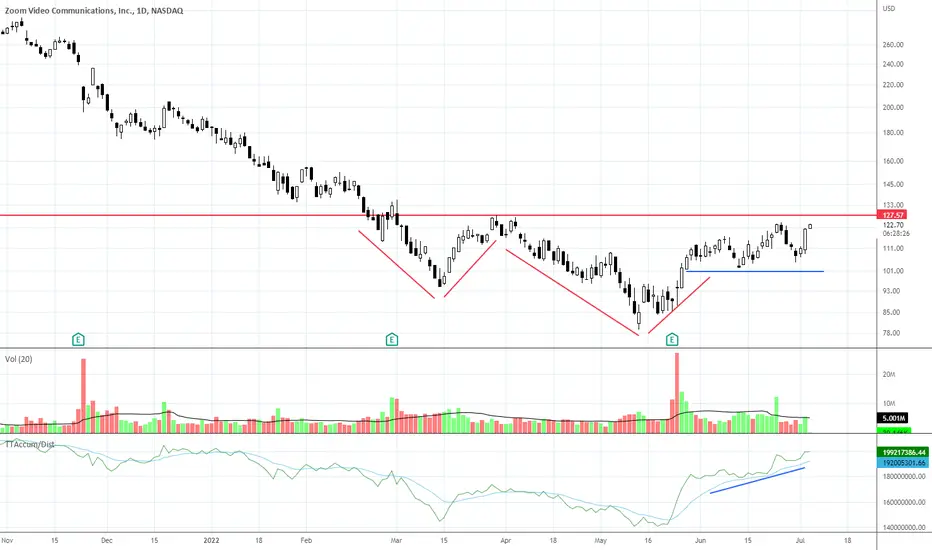
ZM - inverse Head & Shoulders in the making?I am watching to see if a breakup will materialise, and when it does, a high volume breakup will greatly improve the odds of this pattern succeeding.
This pattern is formed over 3.5 mths+ which is rather short (6 months or more prefered), meaning it could face more near term resistences on the way up. If it could go above 135 eventually then the coast will be clearer.
Disclaimer: Just my 2 cents and not a trade advice. Kindly do your own due diligence and trade according to your own risk tolerance and don't forget that money management is important! Take care and Good Luck!

Shorting $ROKU is a possibilityKeeping an eye on $ROKU for a move back to lows. The break of the trendline is bearish, 30-100$ retracement is likely.

ZOOM BUY SIGNAL EMA13/48Technical analysis: The EMA13 / 48 crossover is currently giving a long signal. Buy pants on the foot right tomorrow.
I don’t use a big lever for this trade because it may need room to start at the beginning
Can be a good longer term swing trade
tp at first 127

ZM Short IdeaDownward channel for zoom on the daily. Just rejected the upper trendline and zone. Looking for an entry with a close below the yellow zone. Buying time on this play with the first trim at the next zone with being fully out of the play at the bottom zone.

ZM 6/5/2022ZM
Zoom Zoom, it can’t go any faster downhill.
A lot of money was made here during Covid for obvious reasons. The party is over and I’m sure many “Investors” aka bag holders are still holding on.
ZM’s Uptrend took price from 71 all the way to about 589.
From there price first broke down thru the 50 ema but found support from the 200ema. It bounced price back above 50ema but that was short lived and the move was deemed a false breakout.
This led to the price breaking below the 20ema and ending the Uptrend. Price now enters a sideways market.
Price fell to around 288 where it bounced but failed to make higher high twice. A Distribution stage and Double Top pattern is created but pending confirmation.
Sept.’21, price breaks down from side-ways range. Distribution stage and Double top are now confirmed.
The next move is a pullback looking to turn Support into Resistance. At that time, we also have an Overbought Stochastic reading. This is the first opportunity to enter trade short. Overbought stochastic + pullback to resistance area + downtrend = Short trade.
After the pullback, price enter downtrend and saw price go from 291 all the way down to 96.
At 96, we saw another small pullback to dynamic resistance at 50ema with an overbought stochastic. This was the second entry to short.
Price made a lower low to 83 and pulled back once again to dynamic resistance at 50 ema. We again have an Overbought stochastic reading. This will be my cue to enter trade short
Will be entering trade short.
Entry: 109.42
Stoploss: 128.80
Target: 61.29, +18.65%, 2.33 RR ratio

Zoom Video Communications, Inc.On the above weekly chart price action has corrected over 80% since the sell signal back in late 2020. A number of reasons now exist to be bullish , including:
1) The ‘incredible buy’ signal has printed.
2) Price action and RSI resistance breakouts.
3) Price action is back-testing past resistance as support.
Is it possible price action falls further? Sure.
Is it probable? No.
1st target $300.
Good luck!
WW
Type: Investment
Risk: <=6% of portfolio
Timeframe: 6-18 months

ZM High-risk Initial LongZoom High-risk Initial Long. SL and TP on the chart. 10-20x leverage. Move SL on TP.

6/1/22 ZMZoom Video Communications, Inc. ( NASDAQ:ZM )
Sector: Technology Services (Packaged Software)
Market Capitalization: $31.645B
Current Price: $107.65
Breakout price: $127.70
Buy Zone (Top/Bottom Range): $106.60-$71.30
Price Target: $189.60-$204.00 (1st), $249.20-$278.80 (2nd)
Estimated Duration to Target: 181-186d, 300-312d
Contract of Interest: $ZM 1/20/23 125c, $ZM 6/16/23
Trade price as of publish date: $15.90/contract, $27.10/contract

ZM and WTZ4 trade setupZM and WTZ4 is simple trade setup I usually apply for trading. Before using the setup, I also double check the higher timeframe (weekly chart) and find TD buy setup also. That might be another sign for reversal pattern.
