What You Could Have Expected From Zoom's Earning Report?It can be tough sometimes to play ER, but I commend those who have the nerves to consistently play ER's. We know prices can go either way when dealing with earnings.
A company can beat on ER and gap down, a company can miss on earnings & gap up. Sometimes it feels like playing the lottery with ER plays.
There are some things you can notate before you play an earnings report.
Like how has the asset been performing leading into earnings? Has it been bullish? Has it been bearish?
What's the overall sentiment surrounding the asset?
How has the asset been performing against the market?
What is the market doing? Does the overall market seem bearish or bullish. Does the particular asset move with or against the market?
Don't just assume what the asset will do regardless of what the chatter is.
Leading into it's' ER, Zoom has been in a continued downtrend like a plethora of other stocks. Seeing this, along with price action leading into ER. I could expect for Zoom to pop after hours, Why?
One reason is that it has been in a steady decline. There were "trapped bulls" at the 107 area & price made a double bottom from the May 20th trading session into the May 23rd trading session around $85.
Seeing that, along with price being in a steady decline & the chatter of a earnings beat. You could have went long with 95-107 calls with a SL at 85(even though SL's are no good post-market). Nevertheless, Zoom pushed to 107 after hours before fading. Again, ER plays are tough, but there is a method to the madness as well. If you played Zoom's ER, I hope you were on the right side of it.
Catch yall on the next post.....Peaaaacccceeeee!!!!
5ZM trade ideas

Zm ideaThis scam is olmost lost all its gains since it was listed . Big Macd divergence observed , also weekly rsi is still severed oversold . Keep in mind that Zm earnings are today after the bell , should they beat estimates it would be a nice ride to at least 120 then 150 . Should they miss estimates then is bound to hit 62 support on the coming weeeks , so choose wisely good luck

A lot of value hereWe have here a company that acquires value with the pandemic, now everybody is using Zoom to make video conferences, you can see the balance sheet improvement, the price is slightly high form the IPO price. If the monkey pox progress, this stock will go back to the $400 level.

ZM Zoom Video at 2019 levelZM Zoom Video earnings call is scheduled for Monday.
The P/E is 20.23, while the price is similar to September 2019.
I think it`s undervalued at this point and my Price target is $127.
Looking forward to read your opinion about it.

ZMLONG-TERM: Bounced off support, classic bullish divergence, testing downsloping channel breakout. (not financial advice)


ZOOM - Avoided -71% Losses by Following Long-Term TrendSign of Weakness in the chart:
1. Mark-Down Stages
2. Sign of Weakness with Bearish signal in Weekly chart
Disclaimer
This information only serves as reference information and does not constitute a buy or sell call. Conduct your own research and assessment before deciding to buy or sell any stock

Zoom will bounce and continue on down! This is what I think will happen with zoom over the next few weeks.
We will continue to bounce from here and potentially hit my identified reversal zone.
Look at my blue and yellow fibs there for confluence.
My purple fibs are my elliott wave projection fibs which are currently estimating A=C. wave C could easily head to the purple 1.618, at which point we would keep an eye out for them heading to the next support zone.
**(I am not sure why Trading view squeezes my chartwork together after I submit it as a public post, but you may have to decompress the x axis to get a better visual)**

ZOOM BULLISH SETUPZoom made a nice falling wedge structure and now after the breakout and pull back formed the minor bearish trend showed another breakout and bullish reversal. Here I expect a decent correction on the fall we have seen on Zoom.

ZM type 2 return after large M shape harmonicZoom is finishing out a type 2 return after a huge M shaped harmonic pattern. There isn't any divergence on the oscillators but the double return and the bottom of the M-shaped harmonic both occur near levels of historic resistance which are now support. I'd like to see reaction off this return before I made an entry.

Zoom placed on a Safe pointZoom Stock is now on a harmless point and can rise up until the Highest price it was and the only thing it want is Patience.
Buy@ 100$
Stop loss@ 40$
Take profit@ 750$
it is so important to buy in several price and step by step... Follow your money management and do not be greedy.

JICPT| ZM consolidates around 100 with possible reversalHello everyone. Last November, I posted an idea titled 'Don't rush to buy Zoom for the new wave of Covid' . I'm actually right, price has dropped by more than 60% since then.
Now, I observed a possible reversal pattern, with downtrend violation. Now, I need $94 to be served as a solid defense line, in addition, $128 is required to be firmly conquered. By then, I would be more interested in the long setup.
What do you think?

Pulse of an asset via Fibonacci: ZM bottom on Genesis 2.618 ?Assets have many Impulses in a lifetime, but only one "Genesis Pulse".
Genesis as in "birth", programmed with all of the DNA it will ever have.
That Impulse determines the "Sequence" of growth spurts and retraces.
Imagine it this way:
- Each person that buys some, tells on average 1.618 others to buy.
- Like an undulating insect swarm, there will be waves of decisions.
- As the swarm grows, the waves' amplitudes grow by 1.618 multiples.
At first the swarm blindly "trips" over each of the levels.
But soon comes to "remember" the exact position of each.
"Indicators" record the turning points, for newborns to see.
The 2.618 extension is always a strong one.
That magic is simple: 1.618 x 1.618 = 2.618.
Thus a strong turn at $105.92 is worth noting.
IF the bottom is anywhere NEAR here, then THIS is it.
.
I do not use "Fibs" in the "traditional" manner (retracements).
I use Fibs to plot "Ripples" (extensions) created by "Impulses".
Then look for "Confluences" to map the "interference Pattern".
My TV collection of ideas detailing the Concepts:
Chapter 1: Introduction and numerous Examples
Chapter 2: Detailed views and Wave Analysis
Chapter 3: The Dreaded 9.618: Murderer of Moves
Chapter 4: Impulse Redux: Return to Birth place
Chapter 5: Golden Growth: Parabolic Expansions
Chapter 6: Give me a ping Vasili: 'one' Ping only
Chapter 7: The Mighty 2.618: like a Rook in Chess
.

ZM is trading around its fair valueI am still only observing it, but if it falls to the 70- 80 dollar level i will get in. This is a quality growth stock. I don't think you can get hurt if you get around these levels.

ZM a long entry at fibonacci levelZM long at this price, risking the lows of this trend. Great last earnings release, I think ZM will be hereafter COVID

ZM back to pre-pandemic level just like IBB BiotechZM & IBB Biotech have both came back down to 2019 pre-pandemic levels.
Pls see my previous ZM post for the chart of IBB. Sorry got confused by similar chart.
ZM just BO above the falling wedge.
Some consolidation probable as ZM may be bottoming.
Not trading recommendation

$ZM with a Bearish outlook following its earnings #Stocks The PEAD projected a Bearish outlook for $ZM after a Negative Under reaction following its earnings release placing the stock in drift D.

Zoom out the Zoom..! The past 3 yearsI think whatever you need to know about a Formation of bubbles and their burst you can see in the ZM chart:
An 805% move in 18 months followed by an 84% decline in the next 17 months:
During that 84% decline, you see a 36% and 48% positive surge, but the aftermath remained the same..!
Even a significant change in the fundamental did not help:
But ZM was not alone, other examples are:
NIO: +5500% followed by -80%
DOCU:
And the mother of All bubbles:
ARKK:
and the Final point:
Gauging Market Changes
The key determinant of whether the market is bull or bear is not just the market's knee-jerk reaction to a particular event, but how it's performing over the long term. Small movements only represent a short-term trend or a market correction. Whether or not there is going to be a bull market or a bear market can only be determined over a longer time period.
However, not all long movements in the market can be characterized as bull or bear. Sometimes a market may go through a period of stagnation as it tries to find direction. In this case, a series of upward and downward movements would actually cancel-out gains and losses resulting in a flat market trend.(Investopedia)
Conclusion:
You can be in the Bearish market yet see the most Exotic Bullish rallies..!
Best,
Dr. Moshkelgosha M.D
DISCLAIMER
I’m not a certified financial planner/advisor, a certified financial analyst, an economist, a CPA, an accountant, or a lawyer. I’m not a finance professional through formal education. The contents on this site are for informational purposes only and do not constitute financial, accounting, or legal advice. I can’t promise that the information shared on my posts is appropriate for you or anyone else. By using this site, you agree to hold me harmless from any ramifications, financial or otherwise, that occur to you as a result of acting on information found on this site.
*I have open positions in SARK(74.36), SOXS(40), TZA(30.60)

Gap Fill to take us down 36%Showing extreme amounts of bearish divergence on the daily, breaking immediate trendline and bearishly engulfing on the daily a pullback to the $326 area seems likely.


ZM Weekly low-risk areasWeekly Bat with Fib levels showing targets. Still oversold on RSI - MACD looking ready to prime for more positive MOMO

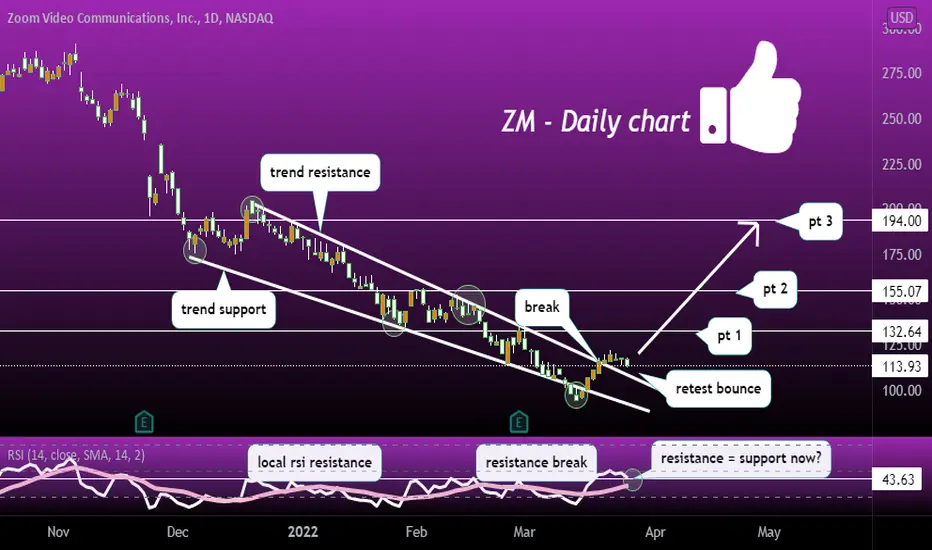
could retest bounce, one of my favorite chart patterns! ZM broke trend/rsi resistance lately, is this the retest bounce (perfect entry)?
Its possible, but time will tell. potential targets are 132.64-155.07-194.00