5ZM trade ideas

ZM Will be available under $300ZM clearly changed how we communicate during COVID. Just the way people mentions GOOGL for searching Zoom has become synonymous for video conferencing in professional. It clearly had its run way ahead of its time pulling forward much of that growth in its stock price. This would be the time to stop the sprint and take a pause for consolidation. So far major gaps have been filled. Now $300 would be a major touchdown target and enter consolidation phase to 290-275 range. Bottom picking can be done when 250 floor has been tested and the growth in earnings continues.


ZOOM future LONGZoom showing us very nice potential for going higher. We are just comming to my HTF demand zone, wait for BFI (banks, funds, institutions) to get into market.
Get in with them.

ZM looks like it could runLooks interesting enough to set some alerts on it. Hopefully that inverse H & S can hit and we can get a good pop.

Parabolic ArcParabolic arcs are long term patterns.
When they correct, they fall 50 to 62% as an average, but 79% or more is very possible. They are often volatile for a while when they find the landing pad.
Parabolic arcs are caused by irrational exuberance.
No recommendation.

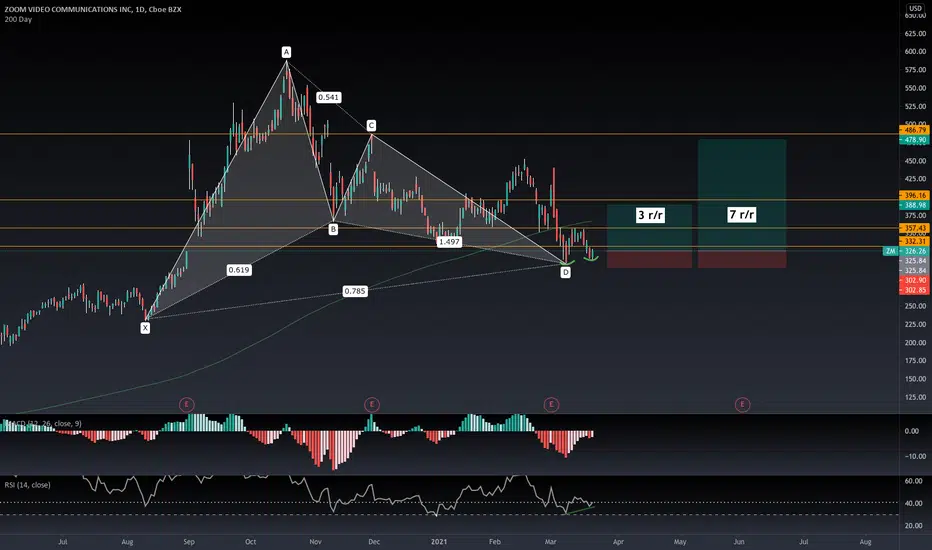
ZMLOND-TERM: Bullish gartley harmonic pattern with a double bottom at the PCZ and bullish convergence on the MACD. (not financial advice)

$ZMIf the price comes down to the (POI) then i think that would be a fair price to buy in and ride it to 1st TP. If it breaks below the (POI) then i would reverse the trade and look for the right oppourtunity to short. Simple as that.
Trade Safe.


ZM is about to double bottomZM is about to test a strong support at 310$ that as been touch recently 08/03/2021, it may create a double bottom
The stock price is currently filling a gap create 01/09/2020 as it suppose to
ZM is in a downtrend and he need to (IT Will!) touche the down green trend line started from is 588$ ATH 19/10/2020
I think ZM need a catalyst to run back up
It is a the bottom Bollinger Band, the RSI is a around 35 if the RSI down to 30 i its a very strong BUY BUY BUY
The potential Upside is huge
The worst case scenario is that it break the 310$ fall to 230
THANKS FOR YOUR SUPPORT, I DO HAVE MORE HOT STOCK TECHNICAL TO SHARE
CLICK THE LIKE BUTTON AND LEAVE A COMMENT

Zoom on Watch Nothing to play but looking for a little consolidation closer to earnings or any breakouts before I look into plays.

Day Trade 1-5 ZoomHere were my notes "RSI looked good, below 100 and 200 EMA, hitting a support, waited for some reversal, still looked a bit questionable and missed a couple times on stop limit buy i believe due to volatility and it triggering above stop buy even though i put in for order when it was below it spiked up, did good to wait it out"

Market Watch Update - Review of list and ZM Short Set-upUpdating the market watch video watchlist from this month.
Hit a lot of our goals and entries quickly this month, so I will post an additional video including new additions to the watch list.

$ZM - Still pointing downIt´s a tricky corrective movement, but this is our primary count at this moment.
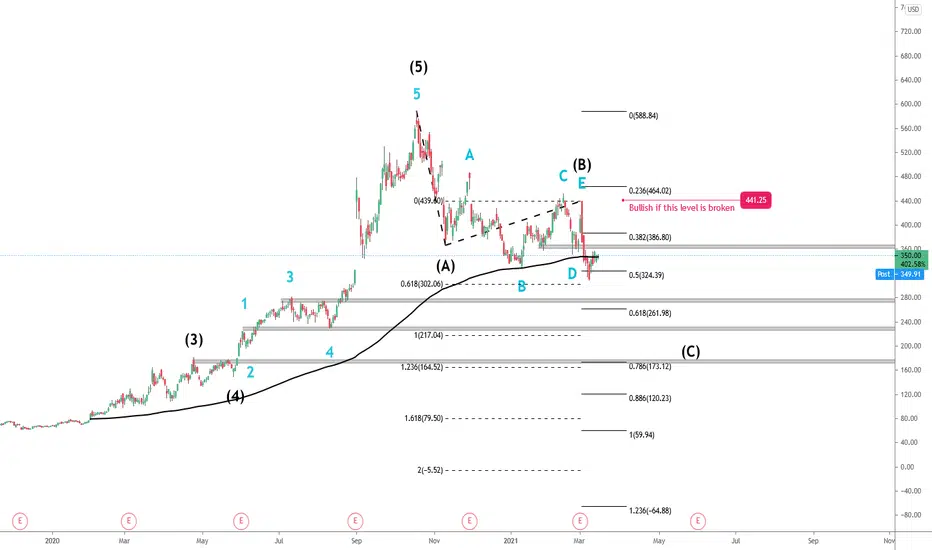
ZM - Getting ready to rally again ?Since price topped October last year, I've been on the sideline with my clients and put this one back into our watchlist a few weeks ago.
Now it seems about to have finished a 3 waves correction wherein wave B is a Triangle.
Triangles precede the last actionary wave in the pattern of one larger degree.
Simply put, it signals that the end of the ABC correction comes after one more move to the downside, in this case after wave C.
This gives us a reason to look for a reversal point.
That reversal zone might just have been found as price bounced off the green 52week EMA and the orange anchored VWAP.
Notice also that price, although it went a bit below the 100% projection of wave C compared to A, is now holding above it.
Same for the 23.6% retracement level of wave 3.
So, for now, as long as price doesn't go below 309, I will look to buy and hold this one towards 441 at first followed by the ATH at 588.
If price does go below 309, I won't dismiss my bullish view but I will stop buying until I have reasons to believe that red wave C ended and price bounced off a potential reversal zone.


Bear Flag: fade the bounce ZM stuck mid-way in a descending channel since Nov. '20. Bear flag setup. Target mid 200's.

Zooming in on $ZM, we see a strong correction underway.Charting for a friend.
On the 1D chart, it looks like Corrective Wave C is underway.
Target price range to look out for is between $194 to $261.
Recommendation would be to wait on the sidelines with your dry powder, on this one.

A pitchfork experimentLearning and experimenting with the geometry tools. Will revisit this in the future to see if I was close or not.


ZMBouncing off the weekly 50 & trendline. Weekly close above 5 week ema ($365ish) would be bullish imo.
