ABNB.NYSE Air BNB - Cup & Handle Pattern Seen.Air BNB has printed a Cup & Handle Pattern which is a Bullish Formation.
Price Targets are projected for your decisions.
Recent price action seems to confirm the Trend. Dedication will be required and is a +2 year Study.
As always, please get a few outside Expert's Advice before taking Trade or Investment Decisions.
Should you appreciate my Chart Studies, Smash That Rocket Boost Button. It's Just a Click away.
Regards Graham.
6Z1 trade ideas
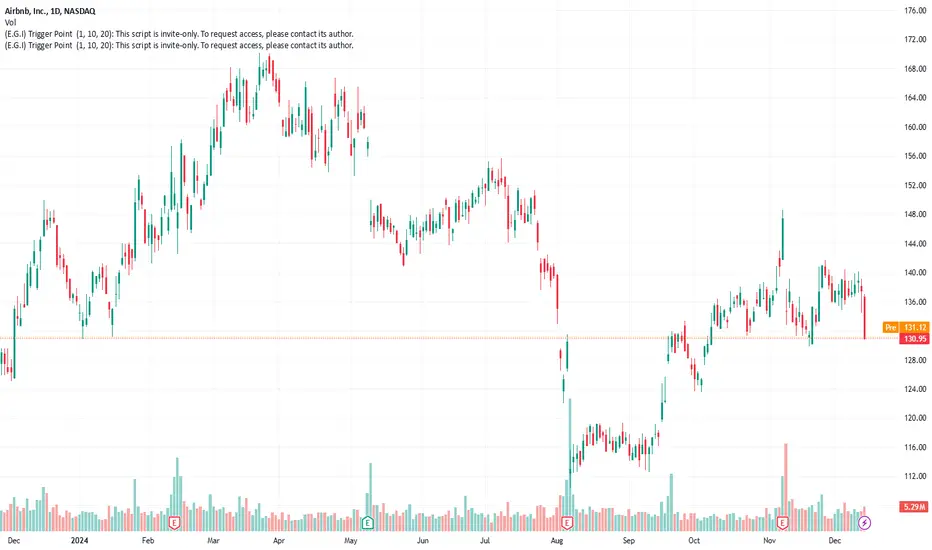
Airbnb Faces Potential Downturn, Monitor Key Levels Next WeekRecent Performance: Airbnb is currently trading at 130.95, maintaining
elevated multiples compared to industry peers. This perception of being
overpriced has raised concerns among investors about potential future price
drops. The stock has struggled to regain momentum, exhibiting volatility as
it fluctuates around previous support levels.
- Key Insights: Investors should approach Airbnb with caution, given its
inflated valuation in the current market landscape. Shorting opportunities
may present themselves as bearish sentiment intensifies. It is crucial to
keep an eye on pivotal support levels and market reactions to any
forthcoming news that could trigger further sell-offs.
- Expert Analysis: The prevailing expert sentiment points to a bearish outlook
for Airbnb, with many suggesting that the stock may experience downward
momentum. Analysts are particularly focused on the company's high valuation
and are on the lookout for potential corrective movements. The general
advice is to remain vigilant and consider short positions, as the
anticipated correction may align with market conditions.
- Price Targets: For next week, actionable price levels based on current
analysis are as follows:
- T1 (Target 1): 126
- T2 (Target 2): 124
- S1 (Stop Level 1): 132
- S2 (Stop Level 2): 135
- News Impact: Despite Airbnb's recent inclusion in the S&P 500, which initially
boosted investor confidence, the prevailing sentiment is shifting due to
ongoing valuation concerns. Analysts have been emphasizing the stock's
volatility as increased scrutiny from the market emerges, leading to
tempered enthusiasm surrounding its future growth potential. Investors need
to stay attuned to any developments that may affect the stock's trajectory.
ABNB Last day before breakout! ABNB is in a super tight consolidation. We have support at 137 within this pattern and upper resistance at 139.60 of this pattern
This pattern targets 146 which is the weekly overall down trending resistance if we break upside.
If we get caught up from Movingnaverge resistance on weekly that is between 142.50-143$. This is my first take profit idea if we can break upside
If we break 136.60 and hold below, this downside might target 131$ This pattern should conclude tomorrow. We have shown the market the resistance we need to break, and any downside test of the pattern was faced with massive buying shooting back towards the 140 resistance .
If we can push through with conviction ABNB may be ready for a good size move up! I am positioned for an upside move. Good luck traders. Use stop loss and risk management in case it goes against the direction of your choice.
ABNB High risk High reward This is going to be a little bit more of a tricky trade, but it does look to be making a symmetrical triangle here within a uptrend channel.
Currently, we are holding $136 as the support and we have a resistance 138.68
If we can clear the 139 area and hold it as support, our first resistance is one 14340 and if we can clear the actual uptrending channel resistance, we can see as high as 145
Moving averages are getting very tight on the daily timeframe, which means a big move is coming. It’s hard to pick the direction.
However, the support of the symmetrical triangle continues to get tested and the bulls keep popping it back up. If we do lose the support of the symmetrical triangle, then we could see as low as 133.80 and 130$
I am taking the risk and I am going wrong here looking for a push upwards if we do lose 136 and hold as resistance then this trade will be wrong and I will have to take the loss
We have until the 11th to decide direction so this is very tight
Abnb Although a tricker chart, to me abnb seeming is reclaiming its trend after a large drop back to retest the lows one final time. We got a rounding bottom and push back up. This is part of an Eliot wave structure.
I am longing abnb as of today around 137-137.50. Calls for 12.20 137 call cost 3,70
Be careful use stop loss. Below 134.50 is a fail idea
ABNB Long. Downtrend will prevail. I am going to long this in the box when it gets hear in the coming years. Will wait patiently. Downtrend is still intact on the high time frame. Major support in the box according to multiple fib pulls that I use. Will buy and hold at these levels. Gains of $190 would probably invalidate this trade and we would see all time highs. Will update in the future!
AirBNB Is A Buy Before EarningsAirBNB will present its quarterly figures tomorrow.
For us, the share is a buy ahead of earnings for the following reasons:
The share is currently trading along its long-term mean, so there are no signs of any exaggeration in the price. The daily and weekly charts also show a hidden bullish divergence in the OBV. We expect the AirBNB share price to rise to the USD 151 to 156 range in the short term, which corresponds to an increase of around 7 to 10 percent.
Airbnb Approaching Key Resistance Ahead of EarningsUpcoming Earnings
Airbnb Inc. (ticker: ABNB) is scheduled to report earnings after the market closes today. The consensus Earnings Per Share (EPS) estimate for the fiscal quarter ending September 2024 is US$2.17. The reported EPS for the same quarter a year prior was US$2.39.
200-Day SMA Ahead
Airbnb has been rallying since putting in a bottom at US$110.38 in August. Both price structure and the Ichimoku indicator suggest that the ABNB stock is trending higher. However, given that price is now within striking distance of testing the underside of the 200-day simple moving average (SMA – currently at US$143.56) and trendline resistance (drawn from the high of US$170.00), buyers will likely adopt a cautious stance at current levels.
Any reaction from the 200-day SMA could force the stock’s share price lower to retest the space between the Ichimoku’s Conversion Line (blue) and Base Line (red) at US$138.06 and US$133.26, respectively. At the same time, a deeper correction may prompt a retest of the Ichimoku Cloud (made up of the Leading Span A and B at US$135.66 and US$127.75, respectively). Assuming a breakout higher, nevertheless, this could have the stock test a trendline support-turned-possible resistance, taken from the low of US$81.91.
Price Direction?
Investors, particularly those with a bullish bias, will be focussed on this stock’s 200-day SMA and the accompanying trendline resistance. A breakout above the aforementioned resistances could pave the way for further buying towards the trendline support-turned-possible resistance. Yet, any rejection of the current resistances may also spur dip-buying from the space between the Ichimoku’s Conversion Line and Base Line.
Airbnb (ABNB): Bearish Setup or a Bullish Surprise?After finding support at $113, Airbnb NASDAQ:ABNB is experiencing a rapid rise, efficiently collecting all the imbalances left behind from the previous drop. As we approach Airbnb’s earnings report this Thursday, the company is expected to post a year-over-year decline in earnings, despite higher revenues for the quarter ending September 2024. The sustainability of any immediate price changes and future expectations will largely depend on management’s discussion during the earnings call.
While we don’t base our strategy solely on the earnings outcome, it’s crucial to note that a favorable outlook from management could give the stock a short-term boost. Still, despite the potential for this optimism, our analysis remains bearish on NASDAQ:ABNB for the foreseeable future.
Technically, the 61.8% Fibonacci level aligns perfectly with the point of control from the past three years, offering a strong setup. If this level is reached, it would also complete the filling of any remaining price imbalances. This makes for a compelling hedge against our other swing-long positions.
We aren’t setting a limit order just yet. We prefer to observe the market’s reaction to the earnings report before making a move. This could mean placing the limit order the following day, depending on how NASDAQ:ABNB behaves during and after the earnings call. For now, we remain patient and prepared.
Airbnb | ABNB Airbnb is the leader in Alternative Accommodations and experiences. I believe their community of individual hosts and strong brand differentiates them from travel peers. The emerging trend of long-term stays would boost Airbnb’s profit margins and expand the entire travel accommodation market size
Airbnb estimates its current total addressable market to be $3.4 trillion, including $1.8 trillion in short term stays, $ 210 billion in long term stays, and $ 1.4 trillion in experiences. Coupled with a notably underpenetrated market size, the global travel market is growing at an above GDP rate. Airbnb’s current market penetration represents less than 2% of the share. As such, there is a huge runway for Airbnb’s growth over the next decade.
In terms of competition, most Online Travel Agencies (OTA) provide traditional hotel accommodation (Marriott, Hilton, Accor, Wyndham, and InterContinental, for example). These OTAs are not the real competitors for Airbnb. Instead, Booking.com (BKNG) is expanding its traditional hotel business into the alternative accommodation industry. Expedia (EXPE) entered the alternative accommodation market via the acquisition of VRBO in December 2015. However, Airbnb has the first-mover advantage with a very strong brand. I believe Airbnb’s technology and supplies are superior to their peers, and it is hard for Expedia and Booking.com to compete against Airbnb in the alternative accommodations space.
One of the main expenses for Online Travel Agencies is sales and marketing. They have to spend billions of dollars on Google, Facebook, and other social media platforms to attract traffic.
The table below shows the sales and marketing expenses as a percentage of sales. Both Booking.com and Expedia spend almost half of their sales on sales and marketing. According to Airbnb’s disclosure, 80% of their website traffic comes from direct and organic search. In contrast, Booking.com and Expedia only have 60% direct traffic. In other words, Airbnb has the highest brand awareness among these travelers. With a high ratio of direct traffic and organic search, Airbnb spends much less than its peers.
In Q1 FY23’s earning call, Airbnb indicated their sales and marketing expense as percentage of sales would remain the same in FY23.
In late 2019, Airbnb's costs were rising, and growth was slowing. They spent a huge amount of money on performance marketing, which was basically selling their products as a commodity. Their product was looking less different from their competitors. When the COVID occurred, they lost 80% of sales in eight weeks, and they shut down all marketing spending. Interestingly, when the travel market rebounded, Airbnb's business came back to almost the same level as before, with much less marketing expenses. Currently, they spend much less on performance marketing, and most of their expenses are focused on their products/services. They have had 600,000 articles about Airbnb. These efforts have put Airbnb in a much better shape today.
90% of Airbnb's hosts are individuals. Airbnb can capitalize on the personal experience provided by these unique individual hosts, as opposed to a standard hotel service. Customers can find unique properties, differentiated amenities, as well as local insights from these individual hosts.
Airbnb is putting in a lot of effort into the experience market. In Q4 FY22's earnings call, Airbnb expressed that they were beginning to ramp up their Airbnb Experience business and expect to launch more products/services over the coming years. In my opinion, Airbnb Experience may not bring notable direct sales to Airbnb, but it would enhance the stickiness and loyalty of Airbnb's customers. Airbnb Experience would make the Airbnb platform unique and boost their sales indirectly.
Furthermore, Airbnb Experience could become more relevant with AI technology. In Q1 FY23's earnings call, Airbnb disclosed that they are building AI into their products. Airbnb is working with OpenAI ChatGPT, and Airbnb will embed ChatGPT into their app. The AI powered product will be launched next year.
Leveraging AI technology, Airbnb can make their Airbnb Experience and accommodation recommendations more relevant to any consumer. To put it another way, Airbnb would know your preferences for travel destinations and accommodations before you start searching for anything.
Long-term Stay: As disclosed, 20% of Airbnb's gross bookings are long-term stays currently. Long-term stays are the fastest-growing segment in terms of trip length. The pandemic also accelerated some inevitable growth for long-term stays.
Long-term stays mean higher margins for both hosts and Airbnb. In Q1 FY23's earnings call, Airbnb indicated that long-term stays would be one of the biggest growth areas over the next five years. Airbnb made over a dozen upgrades to long-term stays based on affordability, and they also have new discounting tools for hosts on weekly and monthly stays. Airbnb expects more hosts to exclusively list long-term stays with Airbnb.
In addition, 62% of Airbnb's guests are under 34 years old, and Airbnb is focusing on the next generation of travelers. These young customers are more likely to use Airbnb as the platform for long-term stays. The key thing to remember is that more long-term stays mean higher margins for Airbnb.
Airbnb indicated that, in the current macroeconomic environment, consumers are looking for affordable ways to travel on Airbnb. Airbnb is adding more affordable accommodations to their platform. The average price of Airbnb rooms is only $67 per night.
Before the pandemic, 80% of Airbnb's sales were coming from either cross-border or urban accommodations. The cross-border business would contribute more sales to Airbnb than other types of travel. The cross-border traveling could be very weak if high inflation persists. Despite this, the global travel market had been growing fast in the past, and I expect the growth will continue in the future.
We are using a two-stage DCF model to estimate Airbnb’s fair value. In the model, we assume 20% of normalized sales growth rate, which we believe is quite conservative.
We assume they can expand their operating margin by 30bps annually and will reach 25.5% in FY32.Their free cash flow conversion was quite healthy in the past, and we assume they will deliver 35.8% in FY32.
In addition, we use 10% of WACC, and 15% of nonGAAP tax rate in the model.
The present value of Free Cash Flow to the Firm (FCFF) over the next 10 years is estimated to be $32 billion, and the present value of terminal value is $88 billion. As such, the total enterprise value is estimated to be $120 billion. Adjusting gross debt and cash balance, the fair value of the stock price is $ 200, according to our estimate.
All things considered, the huge underpenetrated market, strong brand awareness, and growing trend of long-term stays, in my opinion, will provide Airbnb with a huge runway for growth over the next decade. Their competitors are way behind them, and Airbnb would be the best player for the alternative accommodation service provider. In my view, the current stock price is significantly undervalued, and we encourage investors to buy during the weakness.
at the end I always bet on Brian Chesky
Who is buying this? I do not trade stocks because they do not live in the real world. They live in lala land where PE no longer matters. Reality has taken a back seat to FED jawboning and flagrantly cooked up jobs numbers. That being said, there are some opportunities that are too tempting to pass up!
I do not even know where to start...
This one really smells... from insiders dumping to the basic fundamentals around Airbnb. Airbnb has no moat! Assigning the majority of the vacation rental market to its market cap is lunacy. Competitors have already begun to take back market share offering the same exact listings with more competitive fee structures.
Personally as a former Super host and and avid traveller I can state first hand that my experiences with Airbnb have gone from bad to worse. The percentage fees they charge both the host and the guest are outrageous when you consider what you actually receive from the platform... Nothing!
In addition to user experience, the general view on STRs has shifted. This has created a difficult landscape for hosts and the platform as governments have regulated and outright banned the platform.
Fundamentals of the business aside, the macro back drop for travel are bleak. The S&P is at all time highs but if you pop the hood the reality of the real economy is bleak. Savings are almost at record lows while credit card debt is at record highs. I can go on....
Personally, I am salivating at the prospect that some poor soul will continue to buy Airbnb and let me borrow their shares at the 140 level.
If you are a believer in a "soft landing " I would approach this as a pair trade
Historically 50 basis point cuts are BEARISH. They are a sign of panic by the fed. If the US does enter a recession travel will be one of the hardest hit sectors.
$140-$155 is the zone in which I will build my short position.
ABNB short term short & a trading system development ride alongSo I'm not one to short. For a lot of reasons. I HATE margin. It's like a credit card where the things you bought can go up in price after you buy them, you're charged interest on them immediately, and the "credit card" company can require you to pay your bill early. As someone who has never in my life carried a balance on a credit card except accidentally, that is 100% NOT my style. Margin creates an added layer of complexity and difficulty to any trade it involves.
Add to that, shorting is potentially infinite in the losses it could create, whereas the gains are capped at 100%. Others may use it, but it's not for me and it is ESPECIALLY not for those new to trading. It is a ticking time bomb waiting to explode your finances and knock you out of the game, and possibly your home. To be honest, (unpopular opinion alert) if you can't afford to be trading your own money and have to borrow money to be able to trade, you probably should NOT be trading. OK, I'm done ranting.
What I am about to describe has to do with the process of how I decided to do this trade. I'm going to leave out some of the details, because
a) a trader's gotta have his "secret sauce"
b) a lot of you are new to the game and if I told you all I know about what I'm gonna do, and especially WHY, you'll take it the wrong way.
DISCLAIMER: DO NOT TRADE THIS WITH ME.
This is an unproven system. My regular system works great on long trades, but historically not that great on shorts. That's not entirely surprising since the market has a general upward bias to it. There's more reasons why, but you don't get to know those (secret sauce).
The system I'm working on for shorts did evolve out of my original system, though. I am a person who when something I try doesn't work, I have to know WHY. And I think that's good advice for traders developing a trading system (or more importantly, following someone else's fancy charts that you don't understand).
If you make a trade and it doesn't work, you should make sure you know WHY. Don't blame it on the market or the Fed, or shorts, or whoever. If a trade goes wrong, YOU potentially made a mistake somewhere. And that's ok. Sometimes they are unavoidable mistakes. But sometimes they aren't, and you owe it to yourself and your system, to understand what went wrong so you can fix it if it's fixable.
So this system I'm testing "live" in front of you, began as I tried to answer the WHY of my system not doing well on overbought calls the way it did on oversold. I noticed a curious feature of the overbought calls it made, and asked "is that consistent enough to be tradeable?" If not, I had to go back to square one. If it was, the only way I'd know for sure is to backtest it to death. And I have been, for months.
I had to tweak some things, but here we are, so obviously it passed that test. The next question became HOW to trade it. I started with a rant about margin and that's the simplest way to trade shorts, in many ways. I knew that was not for me though, so it left me two options. Pun intended.
One was inverse ETFs that move the opposite direction of the underlying stock or ETF. The problem is that not all stocks have them and the ones that do, often trend HARD and that's not good for what I'm trying to do. For some of the ETFs it works OK and I'll probably use them from time to time here as I work out the kinks of my system.
The other option is put options. Both inverse ETFs and put options do something important for shorting, and that's limit your losses. You can only lose 100% of an option or ETF, and that levels the odds out a little bit with shorting. Options, however, introduce TIME as a variable, making things much more complicated. Now, in addition to being right that the stock is going down, I have to know WHEN as well. That's why ordinarily I don't use options as much.
Sometimes the market has ideas for a stock that are VERY different from my own and trades that normally work out in a few days, end up taking much longer (see my idea on NYSE:BROS as an example of that happening).
With options, every day that trade takes costs me money because of time decay. But I'm going to use options here, because my backtesting tells me that 1) time usually shouldn't be a factor and 2) the leverage in options (in THIS case) can help minimize the effects of the times a trade doesn't go according to plan.
My backtests on ABNB and other stocks, tells me how long a trade will likely take to work out. That's important information to have when choosing WHICH put option to trade. It also affects the strike price I choose. I'll be honest when I say I'm not sure I have chosen the optimum options strategy, expiration and strike here - and that's a big reason why you shouldn't trade this with me. If I make mistakes it will cost me money. You can learn from my mistakes for free by just following along.
So for ABNB, in its albeit short entire trading history, the short calls my short system made worked out positively the vast majority of the time and the trade generally took less than a month to play out. For this reason, I chose November 15 expiration. It gives time for the trade to work out before time decay really starts costing me money, since decay accelerates closer to expiration. I could have gone out further to avoid decay, but nothing comes for free in the markets - I'd have to pay more for the option.
I chose puts as close to the current price as possible, because the trades I'm looking to make aren't 20 or 30% moves in the stock. They are relatively small gains like my long system that pay off in volume rather than size of the wins. I won't go into a full discussion of options pricing. I'm not the guy for that anyway.
The mechanics of the trade are different than my long trades. Here, only one lot will be purchased. I will hold it simply until the stock price is lower than when I originally made the trade. If it never gets lower, I could lose 100% of the money I spent on the option unless I cut the trade short - and that is a non-zero possibility that I understand going into the trade. But like my long system, the winners should collectively compensate for those and interestingly, that was part of the reason I choose options. That would be much harder to do here with just shorting the stock because the changes in price here are smaller than with my long method. They will be shorter trades as well, in most cases.
So today, at the close, I purchased the November 15 $130 put on ABNB for $6.90 ($690 dollars). As soon as ABNB stock is below 131.18 as it approaches the close, I sell it. If that's Monday, it's Monday. If it's a week from now, fine. Longer than that and I'll start getting "nervous" because if it takes longer than a week, things become a little bleaker for the trade's prospects.
So there it is. Good luck to me, not you because you're just spectating. I'll update things as the trade plays out and will do a post-trade analysis however it turns out. Enjoy your weekend!
If you have questions or comments about anything I've written here, feel free to comment and I'll answer them as soon as I can.
This is obviously market-based financial edutainment and is aggressively NOT investment advice, as I think I've made clear here. Not only do I not encourage you to trade it, but if this trade works as expected, you won't be able to successfully at this point. Just enjoy the show, everyone. 🍿🥤
Airbnb (ABNB): Holding the line, but for how long?!After charting Airbnb one month ago, we’ve seen another slight dip, and one of our members rightly pointed out that Airbnb has reacted well to the $113.60 price level. This level has acted as support for the fourth time now, and it seems like it could hold. However, t here’s a big BUT —we’re not placing an entry just yet. Trying to catch the exact bottom of Wave 1 can be risky and extremely difficult. Instead, we are more focused on waiting for a possible short opportunity if Airbnb rises again.
Airbnb continues to struggle, and we don't want to catch this falling knife too early, risking unnecessary losses. We’ll keep monitoring the situation closely, and if we gain more confidence that this is indeed the end of Wave 1, we’ll let you know. 🫡
Airbnb (NASDAQ: ABNB) Shares Surge on Bullish SentimentShares of Airbnb (NASDAQ: ABNB) surged by 5.8% during early trading after Bernstein SocGen Research Group reiterated a 'Buy' rating on the stock. Despite recent pessimism, analysts argue that the market is undervaluing Airbnb’s potential, highlighting that revenue growth could surpass 10% with stable margins. However, after an initial jump, the stock settled at $122.08, up 3.9%, suggesting the market views the news as positive but not transformative.
Technical Outlook
From a technical standpoint, Airbnb’s stock has experienced considerable volatility over the past year, with nine moves greater than 5%. The stock recently broke out of its downward trajectory and is now in a rising trend, supported by a Relative Strength Index (RSI) of 55. This reading indicates a balanced position—neither overbought nor oversold—pointing to more potential for upward momentum.
Adding to this bullish technical setup is the broader performance of the NASDAQ Composite Index, of which Airbnb is a part, currently up 19% year-to-date. This signals a strong market environment for tech and growth stocks, giving additional tailwinds to Airbnb's potential rise.
Market sentiment is also keyed on Jerome Powell’s upcoming announcement regarding a potential interest rate cut. A favorable decision could further fuel Airbnb's momentum, making the stock more attractive to investors seeking to capitalize on lower borrowing costs.
Fundamental Drivers
While the technical outlook is promising, Airbnb’s fundamentals offer a more mixed picture. The stock is down 9.2% year-to-date, trading 27.4% below its 52-week high of $168.18. Investors who bought Airbnb shares during its IPO in December 2020 would now be looking at a 15% loss. Despite these challenges, Airbnb remains one of the most profitable tech companies globally, boasting impressive free cash flow generation and a vast network of over 8 million hosts.
However, its recent earnings call raised some red flags. The company reported a 16.6% drop in stock price after missing Wall Street’s bookings and revenue guidance expectations. Additionally, Airbnb has signaled slower revenue growth for the second half of 2024, with a slight 1% downward revision in growth projections and a softened EBIT margin outlook due to stagnant development in its take rate.
That said, CEO Brian Chesky has outlined key strategies to unlock what he calls "optionality value." This includes making hosting easier, expanding the "experiences" segment, and increasing event-based short-term rentals, like during the Paris Olympics, where Airbnb offered 150,000 homes. These initiatives could provide new avenues for growth and help the company diversify its revenue streams.
Valuation and Future Prospects
Airbnb’s current valuation sits at a fair value estimate of $120 per share, suggesting it’s slightly undervalued. However, its growth trajectory will heavily depend on its ability to successfully expand beyond its core offerings in home-sharing and capture new revenue streams, such as event hosting and cultural experiences.
The stock's potential for further growth is reinforced by its strong global presence and its position as a disruptor in the travel industry. As consumer trends shift, especially among younger generations, the "sharing economy" model that Airbnb spearheaded will likely continue to gain traction. In particular, regions like Southeast Asia and Latin America show promising user growth for accommodation-sharing platforms.
Conclusion
While Airbnb’s stock has been volatile, With solid cash flow, a robust global network of hosts, and initiatives aimed at unlocking additional value, Airbnb (NASDAQ: ABNB) is positioned to benefit from both macroeconomic trends and internal strategies. Investors should closely monitor key developments, including potential interest rate changes and the success of Airbnb’s diversification efforts, to gauge the stock’s future trajectory.
Airbnb Inc (Extended hours) | Chart & Forecast SummaryKey Indicators on Trade Set Up in General
1. Push Set Up
2. Range Set up
3. Break & Retest Set Up
Active Sessions on Relevant Range & Elemented Probabilities;
* Asian(Ranging) - London(Upwards) - NYC(Downwards)
* Weekend Crypto Session
# Trend | Time Frame Conductive | Weekly Time Frame
- General Trend
- Measurement on Session
* Support & Resistance
* Trade Area | Focus & Motion Ahead
# Position & Risk Reward | Daily Time Frame
- Measurement on Session
* Retracement | 0.5 & 0.618
* Extension | 0.786 & 1
Conclusion | Trade Plan Execution & Risk Management on Demand;
Overall Consensus | Neutral
Airbnb, Inc. (NASDAQ: ABNB) Airbnb's stock has shown resilience in the market, backed by steady revenue growth projections and a strong balance sheet with minimal debt. However, the company faces challenges that could affect its short-term earnings, leading to a cautious outlook from analysts.
Technical Indicators:
Relative Strength Index (RSI): The RSI stands at 36.09, indicating that the stock is approaching oversold territory. This could signal a potential buying opportunity for investors if the RSI dips further below 30.
Moving Averages: The stock is currently trading below its 50-day and 200-day moving averages, suggesting a bearish trend. However, if it manages to break above these resistance levels, it could indicate a bullish reversal.
Valuation Metrics:
Price-to-Earnings (P/E) Ratio: At 15.26, Airbnb’s P/E ratio is reasonable, suggesting that the stock is not overvalued compared to its earnings.
Price-to-Book (P/B) Ratio: A P/B ratio of 9.24 indicates that the market values Airbnb well above its book value, reflecting investor confidence in the company's growth prospects.
Price-to-Sales (P/S) Ratio: With a P/S ratio of 7.03, the stock is priced for growth, albeit at a premium.
Growth Projections:
Revenue Growth: Airbnb's revenue is projected to grow by 5.11% in 2024, with accelerated growth in the following years, reaching 28.13% by 2026.
Earnings Growth: Despite revenue growth, earnings are expected to decline by 8.84% in 2024 before recovering with a 14.81% growth in EPS by 2025.
Airbnb is a stock with both potential and risks. Investors should closely monitor its earnings reports and market conditions. For those with a long-term horizon, the stock's current levels could offer a good entry point, especially if it dips further into oversold territory.
Buy opportunity coming up on AirbnbHello,
A buy opportunity is setting up on Airbnb.
Company: Airbnb
Principal stock exchange: Nasdaq
description: Airbnb, Inc. engages in the management and operation of an online marketplace. Its marketplace model connects hosts and guests online or through mobile devices to book spaces .
Ticker symbol: ABNB
Current price: USD 118.88
Buy price: USD 100
Target price: 220.88
Outlook
Airbnb remains cautiously optimistic about future travel demand. Despite challenges in the market, Airbnb's disciplined cost management and strong brand positioning are expected to support continued profitability.
Recommendation: Hold
Current Price: USD 118.88
Buy Price: USD 100
Target Price: USD 220.88
Given the recent financial update, Airbnb presents a mixed picture. While the company has demonstrated resilience in the face of macroeconomic pressures, particularly in regions outside of APAC, the slowing growth in booking volume and the ongoing challenges in Asia Pacific suggest that the near-term upside may be limited.
Reasons to Hold:
Moderate Growth Outloo k: While Airbnb continues to grow, the deceleration in revenue and booking volume growth, coupled with macroeconomic headwinds, suggests that the stock might face some volatility in the short term.
Strong Long-Term Potential : Despite the near-term challenges, Airbnb's strong brand and dominant position in the global travel market support a positive long-term outlook. The target price of USD 220.88 reflects significant upside potential if the company can navigate current challenges and capitalize on future growth opportunities.
Profitability and Cost Management:
Airbnb's disciplined approach to cost management and its focus on profitability are encouraging. The expected adjusted EBITDA margin, although slightly compressed, still reflects a strong financial foundation that should support long-term growth.
Action:
Should the stock price decline towards the buy price of USD 100, it may present an attractive opportunity to accumulate more shares, particularly if long-term growth prospects remain intact.
Good luck!!
#ABNB on daily chart On the daily timeframe, we can observe a rebound from the demand zone identified on the weekly timeframe. Additionally, an inside bar pattern has formed, and the price has reached the lower Bollinger Band, coupled with an oversold condition on the RSI. All of these factors suggest a potential upward price reversal.
ABNB Weekly & Daily Timeframe In this analysis of #ABNB on the weekly timeframe, the price has reached the demand zone marked by the gray rectangle, indicating a potential area of buying interest. Additionally, there is a ("False Breakout") below the lower boundary of the demand zone at 113.23, where the price briefly dipped below this level before returning inside. This false breakout suggests that the recent downward movement might not be sustainable.
The trading volume has increased as the price attempts to move back above the demand zone, reinforcing the significance of this area as potential support. The RSI (Relative Strength Index) has reached an oversold area below 30, indicating that the stock may be experiencing excessive selling pressure.
See the next chart for daily analysis.