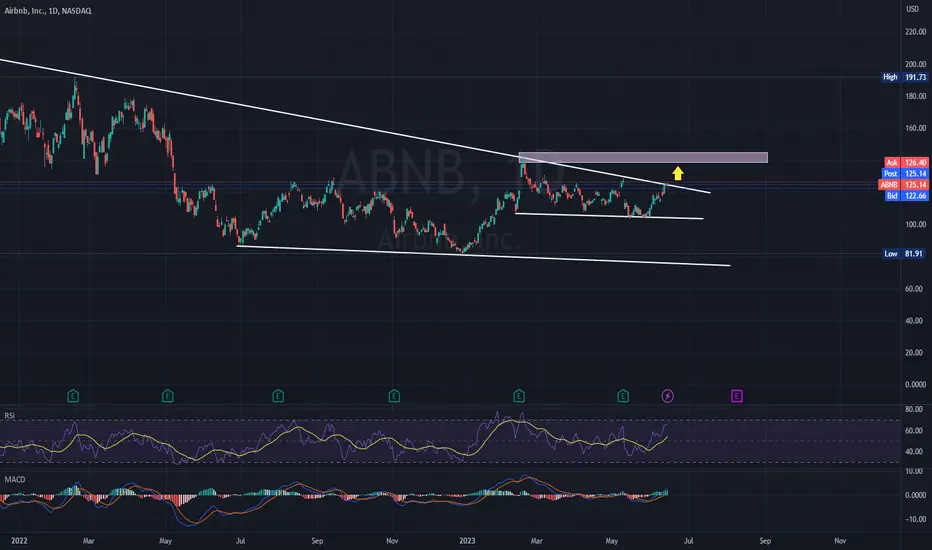
Airbnb Sell OpportunityThis is a basic retest/rejection/reconfirmation setup at both horizontal and diagonal resistances. Based on the candle cluster of the previous six trading days (not including today) which reconfirmed resistance, I've entered short just above 125 and am looking for a target at previous support around the 104ish area.
6Z1 trade ideas

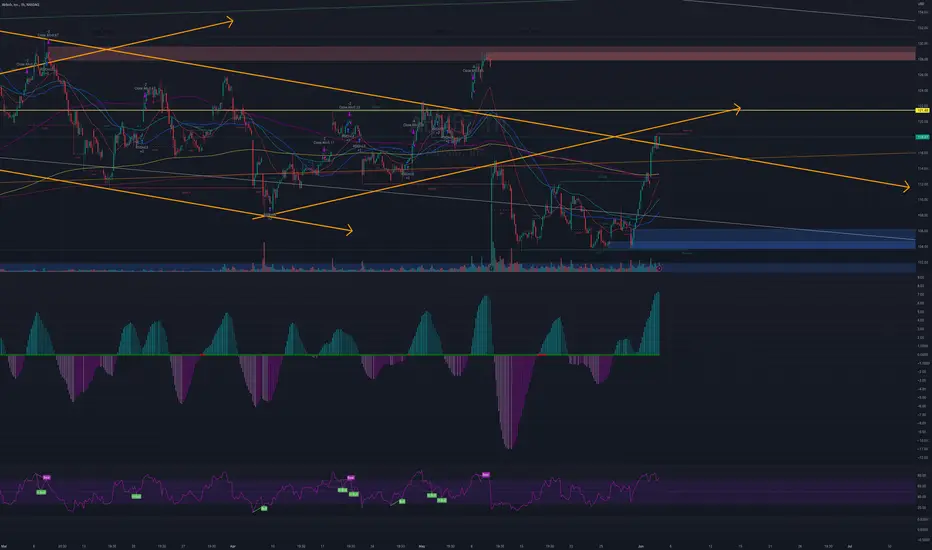
ABNB ready to blast offABNB looks like it´s ready to blast off.
The upsloping support has been holding strong. Now the price is about to retest the resistance. We expect a small pullback to retest the support one more time and after that we should get a breakout and a big move towards our targets.
MACD looks very strong which is confirming our bullish bias .
Good luck

Will Airbnb break through after sortingWill Airbnb break through after triangle sorting ?
This figure shows the Line chart chart of Airbnb stock in the last two years. The graph overlays the recent bottom-up golden section, as well as the connection between high and low points in the past two years, as well as the connection between low and low points. As shown in the figure, the Airbnb stock has broken through the previous downward trend line's upward pressure line, and has recently hit new pressure, starting to emerge from a clear triangular consolidation pattern! In the future, we should focus on the area near the end of the triangle consolidation, and see if the Airbnb stock can accelerate its upward breakthrough!

ABNB - BULLISH SCENARIOAirbnb, the industry leader in alternative stays and experiences, has established itself as the synonymous name in this space, overshadowing its competitors.
Entering 2023, concerns arose among investors regarding Airbnb's ability to generate sufficient demand due to a slowing economy. However, the first quarter proved otherwise, as the company experienced a 20% year-over-year increase in revenue, reaching $1.8 billion. Nevertheless, a slowdown is anticipated, as management expects 14% growth (at the midpoint) in the second quarter. This deceleration can be attributed, in part, to challenging year-over-year comparisons, as the second quarter of 2022 witnessed a surge in demand following the easing of COVID-related restrictions.
Looking ahead, analysts on Wall Street project a 13% revenue growth for 2023, followed by another 13% in 2024. While these figures fall short of the 20% or higher growth rates Airbnb achieved in the past year, they still surpass the industry average and remain impressive for a company of Airbnb's magnitude.
Risk Disclosure: Trading Foreign Exchange (Forex) and Contracts of Difference (CFD's) carries a high level of risk. By registering and signing up, any client affirms their understanding of their own personal accountability for all transactions performed within their account and recognizes the risks associated with trading on such markets and on such sites. Furthermore, one understands that the company carries zero influence over transactions, markets, and trading signals, therefore, cannot be held liable nor guarantee any profits or losses.
ABNB closed above Diamond #ABNB closed above Diamond last week after heavy drop from last earning.
If ABNB still hold above 117$ , will see next stop at 121$. Above 121$ will be : 128/130$
If ABNB cant hold 117 $, will see test back to 115$. Below 115$ will be : 112/106$
$ABNB - Episodic pivot shortAfter a negative reaction to last earning of Air Bnb, a short episodic pivot has formed on the daily chart.
It still could need a day or two, until the 10day MA has caught up with the price.
Entry:
- break of 104.55 level (pivot point)
- Aggresive: touch of 10 ma (if it goes up tommorow)
Stop loss:
- Break of 10 ma
-Aggresive: upward break of pivot point

Puts trade - Double topChart shows a double top, broken support tested and price rejected. I don't think is coming back.

$ABNB Breaking Over 40 Week MA!I went long yesterday (5/31) afternoon just before the close as NASDAQ:ABNB broke over the 40 WMA with a stop below the day low. I added again this morning on its follow through. ABNB may still be actionable if it fits your trading style. I will be looking to add to my existing position once it clears the 50 DMA.
See the notes on the chart for additional thoughts. Ideas, not investing / trading advice.
Thanks for looking. Constructive comments welcome.

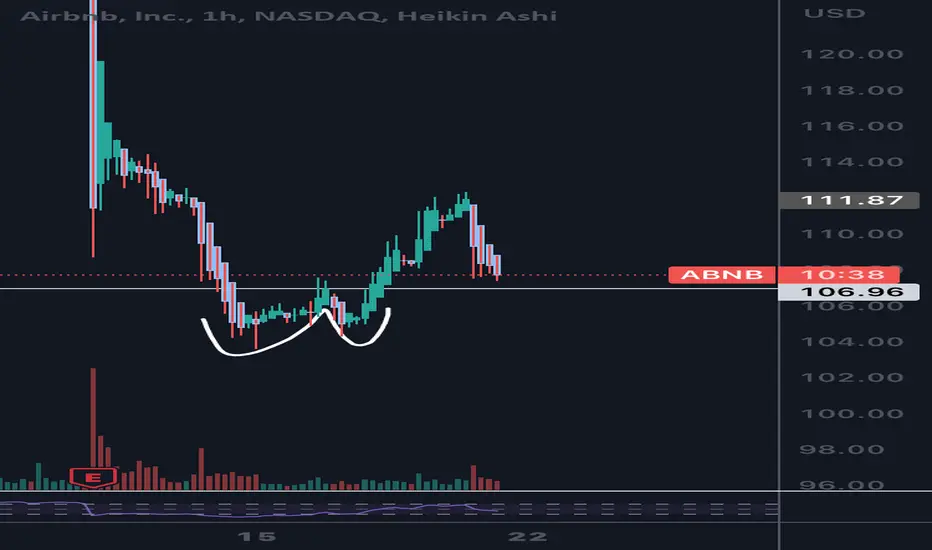
Abnb Looking like a W pattern that broke out. And now abnb coming back in to retest the W pattern as support. I’m going long on 100 calls between 107.50and 107 area. I think in the coming weeks abnb could explode. Good luck be safe probaly would close if we start closing bodys below 107 and opening below as reistance
Airbnb: Holiday home with pool 👙🩳Could you do with a holiday? For Airbnb, there is a nice turquoise pool waiting below the support at $107.10, stretching between $105.87 and $89.00. Thus, the share should hop below $107.10 and dive into the bracing water to complete wave 2 in turquoise. Once refreshed, Airbnb should turn upwards and rise from the pool to continue the overarching ascent. However, there is a 30% chance that Airbnb might have already finished wave alt.2 in turquoise, which would be confirmed by a direct upwards movement above the resistance at $144.63.

ABNB possible long set upABNB recovered quickly from all time lows and has entered on stage 2 early this year.
After gapping up on Q1 earnings, it has given up all it's gains since.
It is now testing, for the 3rd time this year, the 150/200MA after disappointing Q2 earnings where we saw the highest volume of the year. The candle closed big on green so that volume was not selling pressure!!
Yesterday we've had an inside candle and depending on today's close, we can have an opportunity to enter long next Monday.
Risk is 106$ (5,5%) and I would close some gains at 128$ (15%)

Airbnb (ABNB): Lowered Guidance Overshadowed A Good QuarterTrend Bearish
The first thing to make clear here is that companies are not required to say what they expect from the next quarter or year. Many do in order to offer some kind of transparency, but they are not obligated to do so, legally, or otherwise. That became clear during the pandemic when, faced with massive uncertainty about supply chains and consumer behavior, many firms that had previously offered guidance stopped doing so.
Their Q1 results have been completely overshadowed, but they show a company that has achieved profitability and, more importantly, has shown that they can maintain that even in a tough quarter. Over the next few months, that will drive the stock, and not the realistic expectations for a downturn as higher interest rates slow the economy.

Short-Term Bearish Outlook for Airbnb Ahead of Earnings ReleaseNASDAQ:ABNB Airbnb (ABNB) experienced an upswing for the majority of the trading day on May 8th. However, towards the end of the day, it started to break from its intraday highs, indicating potential for a short-term bearish outlook. This trading idea aims to capitalize on this expected downtrend, but traders should be cautious as Airbnb is scheduled to release its earnings report after the closing bell on May 9th.
On May 8th, Airbnb's stock triggered a sell signal on the 15:00 candle, with an entry point of $126.28 and a stop loss at $129.31. Based on this setup, I have identified the following take profit levels:
1. Take Profit 1: $124.05
2. Take Profit 2: $122.74
3. Take Profit 3: $121.42
4. Take Profit 4: $118.79 (for more aggressive traders)
Expectations for May 9th:
We anticipate that the downtrend may continue into the May 9th trading session, but traders should be cautious due to Airbnb's upcoming earnings release. These results could potentially impact the stock's price in either direction, so it is essential to monitor the situation closely and adjust trading strategies accordingly.
In summary, this trading idea suggests a short-term bearish outlook for Airbnb (ABNB) based on the technical analysis from May 8th. Traders should be cautious and prepared to adjust their strategies in response to the company's earnings release on May 9th, which could lead to increased volatility in the stock's price. As always, it is crucial to manage risk and employ proper trading discipline when executing any trading idea.

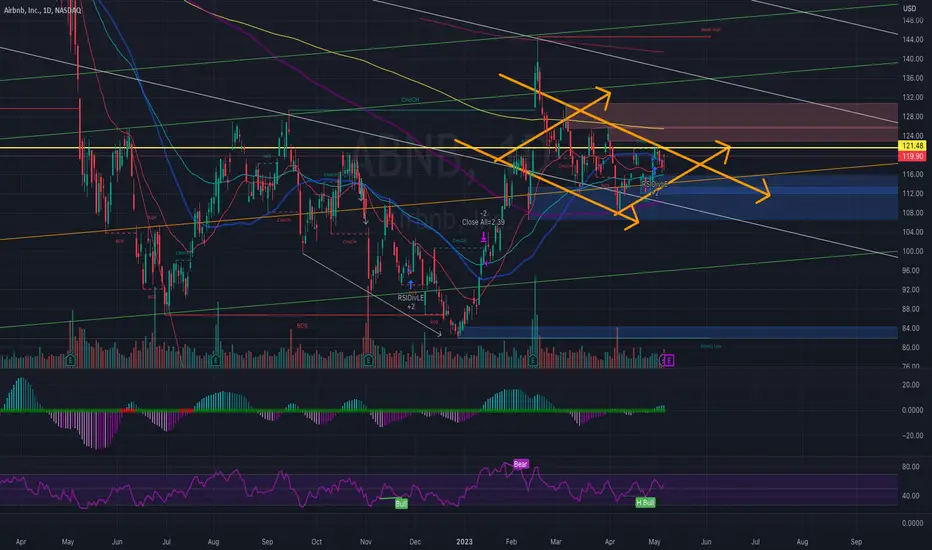
#ABNB DIAMOND break it or make it AS chart, we can see ABNB creating Diamond. So we have to wait ABNB break out or break down Diamond before make decision to play.
If ABNB can break above 121, we can see it bullish up to 133-135$
If ABNB break below 114$ , will see it drop to 110$ ( but with diamond shape break down easily heavy drop to 96-97$)
Cup and HandlePrice broke EL, experienced a throwback, and is now below EL level.
A throwback is different than a pull back. Pullbacks are a healthy for price movement.
A throwback occurs when price breaks long entry level for a pattern then fall beneath that level within a few days.
Throwbacks can hurt performance.
Targets for a C&H are calculated using the cup depth and fib levels. The cup depth is 47.47
No recommendation.


ABNB - Falling Trend Channel [MID TERM]- ABNB is in a falling trend channel in the medium long term.
- An inverse head and shoulders formation is under development.
- A decisive break of the resistance at 145, ideally with an increase in volume, signals a further rise.
- The stock is between support at 110 and resistance at 126.
- The RSI curve shows a rising trend, which is an early signal of a possible trend reversal upwards for the price as well.
- Overall assessed as technically neutral for the medium long term.
*EP: Enter Price, SL: Support, TP: Take Profit, CL: Cut Loss, TF: Time Frame, RST: Resistance, RTS: Resistance to be Support LT TP: Long Term Target Price
*Chart Pattern:
DT - Double Top | BEARISH | RED
DB - Double Bottom | BULLISH | GREEN
HNS - Head & Shoulder | BEARISH | RED
REC - Rectangle | BLUE
iHNS - inverse head & Shoulder | BULLISH | GREEN
Verify it first and believe later.
WavePoint ❤️

ABNB Update: Short Term Trade OpportunityYahoo Finance:
Even though a company’s earnings growth is arguably the best indicator of its financial health, nothing much happens if it cannot raise its revenues. It’s almost impossible for a company to grow its earnings without growing its revenue for long periods. Therefore, knowing a company’s potential revenue growth is crucial.
In the case of Airbnb, Inc. the consensus sales estimate of $1.79 billion for the current quarter points to a year-over-year change of +18.7%. The $9.66 billion and $11.14 billion estimates for the current and next fiscal years indicate changes of +15% and +15.2%, respectively.
Last Reported Results and Surprise History
Airbnb, Inc. reported revenues of $1.9 billion in the last reported quarter, representing a year-over-year change of +24.1%. EPS of $0.48 for the same period compares with $0.08 a year ago.
Compared to the Zacks Consensus Estimate of $1.87 billion, the reported revenues represent a surprise of +1.7%. The EPS surprise was +77.78%.
The company beat consensus EPS estimates in each of the trailing four quarters. The company topped consensus revenue estimates three times over this period.
Technical Overview:
H4 Chart Timeframe:
Advanced Chart Pattern Tracker: Bullish Triangle Pattern and Cont. I SHS Pattern
Cycle Sniper Indicator: D1 Headed North.
Price Closed above P100 Beta Bands. The technical target will be P200 Beta Bands.
Shorter term: Closing above 120$ will confirm the next target at 126$.
Longer term: If it holds above 100 $, targets will be 131.25$ 137.50$ and 143$ .

AIRBNB Stock Chart Fibonacci Analysis 042923Trading Idea
1) Find a FIBO slingshot
2) Check FIBO 61.80% level
3) Entry Point > 118/61.80%


Airbnb ($ABNB) StraddleThis is a Goldman trade idea from their Weekly Options Watch Tactical Trades on 4/19/23: NASDAQ:ABNB 5/26/23 straddle ahead of earnings on 5/2/23. Goldman expects considerable volatility in the growth profile of alternative accommodation booking platform AirBNB. The May 26th Straddle is going for $13.55; breakeven at $128.55 and $101.45. The 1M IV of 48 is only in its 22nd percentile relative to the past year.

ABNB Brake out and BULL flagABNB Brake out from weekly resistance and BULL flag formation.
Wait on brake out and go LONG

ABNB - dark cloud cover - SHORTWe can observe a dark cloud cover pattern. Most likely there's more downside on ABNB therefore it may be a good moment to short ABNB.
Entry , stop loss and target are shown on the chart.
Good luck
