A1G trade ideas

Looking for an undervalued stock ? Buy Airline Stocks We have 4 more months of bull market left, keep investing.


DOUBLE TOP PATTERN AALThis is a double top pattern of American Airlines, and it seems that a downtrend is coming.

AAL Wedge Stock has been consolidating, and overall I think airlines as a sector will have a fall run. Multiple previous touches at support show that there is some underlying bullish factors even if the overall share price has been dropping recently, people have been buying on the dips. Additionally, I would expect a change in overall direction to come around the .618 levels of the larger wave 1 back at the start of summer which is near its current price.

AAL $15 on the wayBlue lines are targets. As we saw the jun 2016 low held the yearly high at a resistance which led to a 25 percent drop to $20. as the month closes and we fail to break above $20 this signals a bearish price coming for the month.

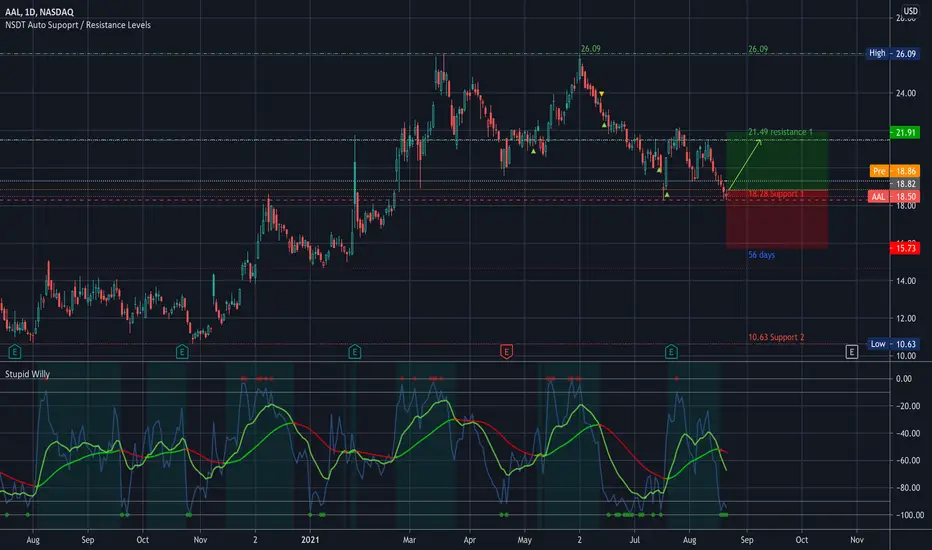
AAL - Daily chart - Long scenarioOverview
Looking to take a long position if price should move as shown with the orange arrow - where i would enter the long on a retest of the blue line.
Target is based on a weekly level.
Dont forget:
- Watch your Risk management
- DYOR (Do-Your-Own-Research)
- This information / article is only for educational purporses and not a recommendation to buy or sell.
I'm not a Financial Advisor.
Thanks for reading!
trader_se

$AAL Analysis & Key levels$AAL Analysis & Key levels
Still in an overall down-trend but looking good for some day or short swing trading.
Sitting slightly above a longer support
I do think that I will be looking to add here today…
———
I have WAY too many positions to be able to update on … So I’m just going to start posting the most recent support and key levels…
Red = Key levels
Green = resistance
Blue = trendlines
Have fun, y’all!!
A review on my short analysis after 5 days!You can benefit from the market when it goes down as well if you know how to do it:
August 15 2021:
AAL:(private post)
You judge the accuracy, it is published when the market was close(weekend)


Airlines are neutral to bearish..!None of the airlines in the charts have any bullish signs!
They all broke their trend lines in the weekly charts and currently they have made consolidation patterns in daily charts!
I am looking for short opportunities in them for the coming week!

AAL patternContinuation + MACD could push AAL downwards. It may find support in the green box, or the demand zone. Short term bearish, long term bullish. May also find support at 200d sma

AAL the maker is trying to make a tricky chartThe best is risk management and also stock capital management , why ?
This chart is full of opposite translation and opposite meanings and different probabilities ,
I give you the main levels of support and resistance , targets for all patterns ,
You should do the best according to the movement and breakout that may occur ,
Except the mainly trending AAL , It is still tricky ..
Take care and have my best wishes ..

8/9 AAL(1) it's a weekly chart
(2) 2 yellow lines as support as you can see
(3) shot-term target 22-25 first

aal w3 setupsame story as ual,
risky move here, but everything checks out for this push up.
w3 target = $26

AAL broke out of the flag pattern and is heading higherNASDAQ:AAL broke out and is set for some considerable gains. Anticipated price action and targets are shown on the charts, stop daily close below 19.5$.
Hit the like button please if you find this useful :)
This is only my own view and not a financial advice, do your own analysis before buying or selling
Happy Trading!

AAL!This stock looks set to drop more.
Having ranged for more than an year, there is high chance a big drop will come in the future.
Trade with care use a stop loss.


8/2 AAL(1) would need another round re-test for AAL
(2) 18 as first support to stop by
(3) long-term bullish, patience would pay

History Repeats !Late August/ Early September $21-$25 Call Contracts should pay quite well. MACD cross, TL line break, RSI divergence. Golden 3 !
Loose stops set (20-25%) but monitor the position daily and play it by ear.
-THIS IS NOT INVESTMENT ADVICE JUST MY PERSONAL TRADING PLAN-


