A1G trade ideas

AAL close to expected BottomAAL appears to be close to finish a 5 wave move to have a bottom in wave C. Watching to see if it breaks above ~12.25 with an impulse to turn more bullish

Look Up Into The Sky - AAL TARGET UPDATEWhat we have here is as typical Wedge pattern with the (E) wave ending at around 11-10 USD.
To confirm this movement we have our CCI indicator which seems to indicate that its losing steam on the downtrend.
And to all the haters saying the airline industry is gonna go bankrupt. The federal loans disagree with you.
If you want to buy, now is the time.


AAL American Airline, an imminent breakout is coming.Following the price action of AAL during the past days, it's clear that Bears failed to retest the lows which I was highly anticipating around 10.30 in fact it made an impressive strong rebounded today from 11.41 low on decent volume. RSI pointing sideways at 42 after bieng downward sloping.
On average volume, today's reverse price action for me is bullish (over the short term) despite all the negative news and sentiment surrounding the Airline industry in general.
My view will be confirmed by a break above 14.29 which was 1 July high, which should be followed by a test to 18.44 then finally a test of 5 June high @ 22.8.
I need to see a decisive breakout of the downward sloping trendline tomorrow or Friday before planning any bullish trades.
This analysis isn't a recommendation and readers should be aware of the high risk involved in trading and must perform thier own analysis before taking on a trade.
I owned a straddle at 13$, got out of the put leg today with a profit, so now I am left with a free call option at 13$.
I don't own AAL stock and I have no plans to owning it for the next 72 hours.
Wise trading everyone.


$AAL - Seems like strong Support Level 12.63 - 12.2 Resistance level - 14$.
Positive trigger for long, with closing above 14$.
Not for any advice, Just an Idea

AAL Tight squeeze - Breakout in either direction prediction: AAL will move a lot tomorrow, which way is always unsure, but the indicators saying UP
American airlines stock will shoot UP tomorrow from FOMO and then sell off after the fomo train leaving people holding stocks all part of the plan.
sell before the sell off.
If AAL dips more then it present a good opportunity to buy dip while its already overselling!
GL trading
may the trump pump be with you!


American Airlines AAL waiting for lower lowStill think we haven't gotten to a wave C correction for this impulse. will reassess if it breaks above ~13.

AAL> hit major support
> made higher high
> anticipation of a higher low that will lead to expansion phase?
> wait for trigger

American Airlines - AAL StockThe idea is to hold - The Majority of analysts are on Sell.
Red line shows a tentative trendline against the Analysts sentiment

AAL may go back to 18$if he break out the shown point will fly to 18$ if not it will go back to 10$. be careful

Nobody knows At this exact point, the chart shows: we are heading to lower levels. The reason I am saying this is: Both indicators are down-trending( lower highs)
and the main trendline( yellow) is still not broken.
On the other side: a Regular divergence appeared on the MACD indicator which predicts a possible trend reversal.
Based on this, I see 3 likely outcomes:
> If the support holds at 12.46 then we might go up a bit to 13.64
> The support holds and we also manage to break out from the current trend, then we might touch significantly higher levels such as 14.70 (the least likely outcome)
> If support breaks, then we might go to lover levels like 10.29


Tasty investment opportunity! American Airlines buy signalsAmerican Airlines (AAL), monthly chart: 12 years long(!) support line + Oversold + Hidden divergence + 2 Hammers


AAL: Channel break outChannel break out
A break and close above 13.70 would confirm the upside move.
Please don't forget to FOLLOW , LIKE and COMMENT ...If you like my analysis:)
Thank you and Good Luck!

$AAL American Airlines Trade to $15.15
Closed above the 7MA & VWAP
Horizontal resistance @ $13.72
Alert set for break above with potential targets
from $14.72 - $15.15 .
Small gap fill potential.
A trade for risk on market only
PLEASE GIVE US A LIKE IF YOU FIND OUR CONTENT HELPFUL, THANK YOU.

AAL Long Position Looking to test out riding what appears to be a bottom and upward trending price movement. Assuming Covid 2.0 doesn't rear its head and affect the movement & support holds around this buy zone ~12.50. Feedback needed! Thank you.

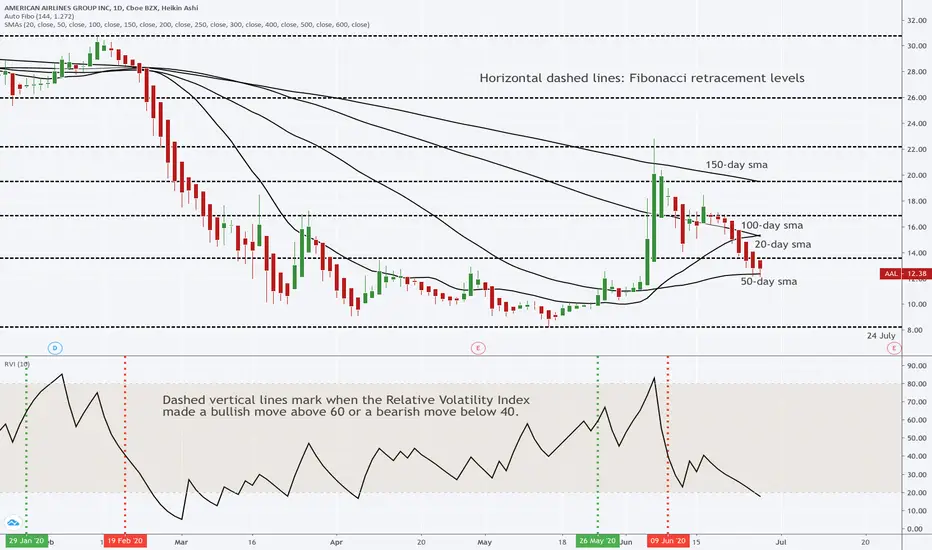
$AAL : Fib retracement, SMAs, and Relative Volatility IndexImpressive buy and sell signals offered by the RVI since December.
High prob of a retest of the 20-day SMA and higher Fib level.
High prob of a retest of the lower Fib level before the RVI exceeds 60 again.
Short in medium-term. Long in the short-term.