#SuakuFlowsWatchlist - 6/9/22#SuakuFlowsWatchlist
$AAL P < 16.11
$AMZN P < 120.75
$MSFT P < 269.61
$UAL P < 44.50
Put on the long trigger for reference but am looking for the downside on all picks.
Scale out when comfortable.
Feels odd to see an $AMZN contract trading so cheaply 😅
A1G trade ideas

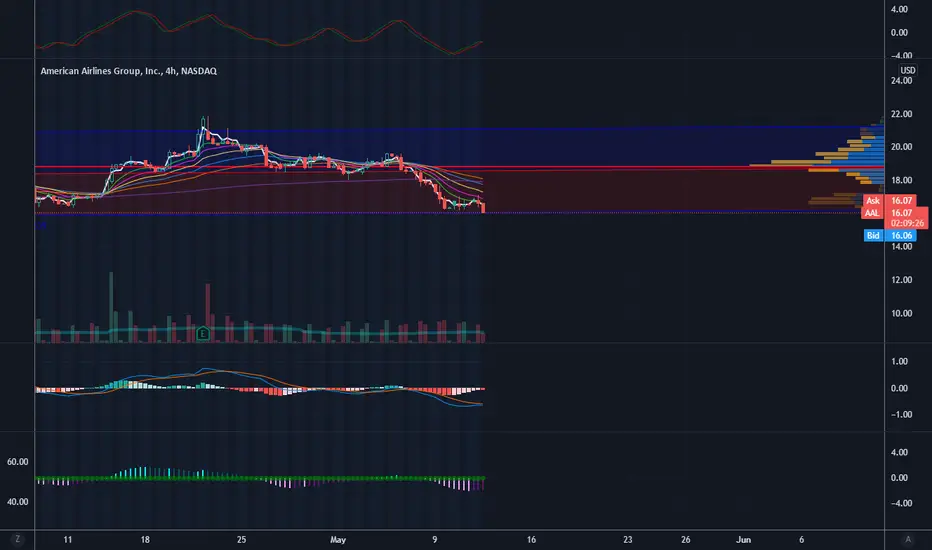
can it break resistance?⛏ if we can get above local resistance area a rally to 19.18-21.12-23.05 is possible

Long AAL.USLong American Airlines stock. We have 3 weeks with decreased body ranges and this week we have a volatility breakout week. Hold one week.

#SuakuFlowsWathclist - 5/26#SuakuFlowsWatchlist
$AAL C > 16.18 | P < 15.41
$AAPL C > 141.79 | P < 138.34
$AFRM C > 23.08 | P < 20.43
$SQ C > 78.95 | P < 74.31
These are my focus picks and key levels going into Thursday's session 🌊
Scale out at 20%.

AAL Bullish inclined naked puts 20 May expiry (May Track 1)Whats The Plan/Trade/Thought
My original intention was to leverage the volatility from the rate increases to enter VXX. However the BP (Buying Power) requirements were pretty high. Making IT less attractive in risk and reward
The airlines sector are seeing signs or recovery with surges over pre-pandemic level in March. United Airlines (21 April) have forecasted a profit this year.
Looking at the Airline stocks with similar prices movements. I decided to sell puts with AAL as I expected traders to jump into this sector with obvious recovery elements. Especially since Tech companies have been victim number 1 with the rising interest rates.
I also saw markets rising after Powell’s address and I figured the volatility was all done. Boy was I wrong haha
I Feel
I’m entering this post entering the trade. Hence my views now are slightly impacted with what has transpired on Thursday and Friday.
I feel I have made the right decision based on the information I had. However Given that my overall stance was that it was a bearish sideways market. 2/3 of my trades should not be bullish. I am not good at predicting the market, so I must be aware of the probabilities across all my trades and not just each individual trade
In my reflection, how I could have also structured this is, riskier trades should be tied to closer expiry dates
Imagine Yourself Taking The Other Side
Right now post entry, post 5,6 May blood bath. It must feel pretty sweet
Imagine Yourself As A Neutral Observer
In all states (Bullish, Bearish and Neutral). We all agree that the market is ranging and is highly volatile. As such the trade currently is not moving entirely unexpectedly. I think was was unexpected was the Bullish market wide move, followed by two red days
Look For New Information
Current bearish price action is a market wide drop. There could be recovery or it could continue dropping. We have some allowance, but it’s getting tighter
How Do I Feel Now
A little worried about Monday, but I know this trade individually is made of sound decision elements. However as part of an overall monthly trade structure, this new trade weakens it
Trade Specs
Sold 350 Puts @ 0.13 - Strike 15.5
% to Strike is 17.5%
ATR IS 5%
BP used 54k
Max Gain: 4322.5

AAL Double Bottom RepeatingAAL has seen its first double bottom pump through a bear phase of this indicator
Now it will see its second double bottom pump through similarly the bear phase of the indicator (in green)

Another Trading Planis it good? what do you think? coz anywhere seems like no chance for trading or i just dont know anything, i dont know

$AAL testing 4h Lin Reg Support$AAL is testing the bottom of 4h lin reg channel. Watching for an entry soon.
AAL looks Close to breakoutAmerican air line looks close to breakout and if AAL successfully break next target is 24$ and after than eyes will be towards 30$.
But if it fails to break out then may visit 15$ again.

AAL rejected AAL rejected and now heading towards 11$.Stock market selloff may accelerate the downward trend.


AALPretty textbook h&s setup. Below $18.50 should see $16. Stop above Friday's high. Keep it simple.

#AAL Technical AnalysisAn example of a head-and-shoulders bottom chart pattern can be expected on the graph. Supply-Demnad zone is the target

AALEarnings on Thursday. Grabbed some lotto Ps today in case the 200 wants to hold. Seeing a lot of optimistic articles lately RE the airline/travel sector. I'll believe it when price confirms (makes a higher high for starters).

American AirlinesBullish Features on AAL, Showing a minor SOS and creates a probable LPS and continuation upward. Looking for a retracement somewhere on the Fibonacci retracement. maybe around 0.618 and take off upwards

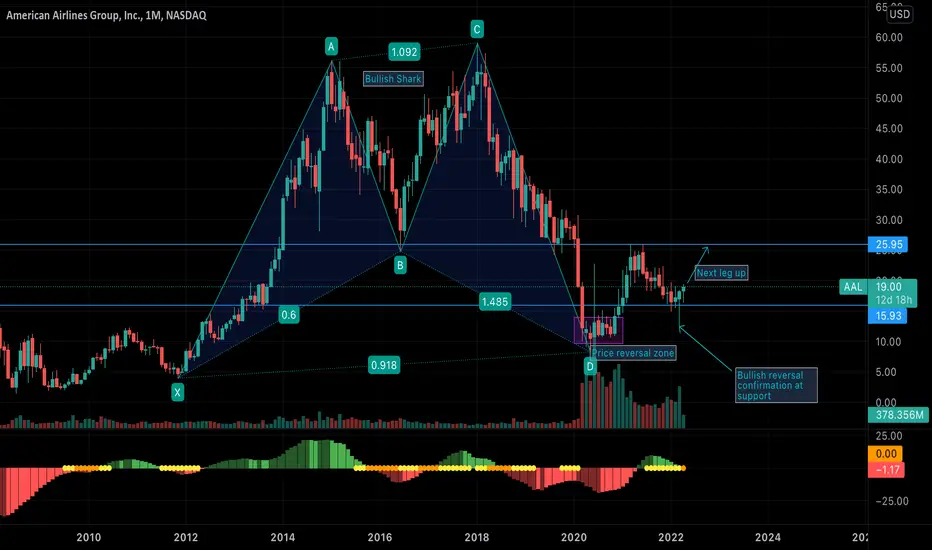
AAL - Bullish reversalNASDAQ:AAL had been in a downtrend since march 2018. After the significant dip in march 2020, buyers shown good interest in it and kept the price above 10 for couple of months, making a strong support level. Bullish shark harmonic pattern has also been formed and price reversed from PRZ(Price Reversal Zone) level. Price marched up to meet the demand of buyers and faced resistance around 25.80 which was a previous support level. Price retraced for couple of months but with low volume. Finally, in march 2022, price did a strong reversal from 16$ support level with a significant volume making bullish hammer. That marks a higher swing low and is a strong indication of a bullish reversal and price is likely to go up to 26$ for a short term target. If it break 26$ level, then a strong bullish trend can be seen.
Inverted Head And Shoulders also on #ALLso yesterday i posted a few ideas of some very clear inverted head and shoulder patterns that are present in the airline companies see also #UAL #LUV both are clearly set up and showing massive opportunities to the top side the biggest being UAL with the measure of a possible 19% upside brining it into the mid 60's price range with in the next. Heading into earnings this we be another play that I will be watching for that possible breakout to the upside!!!

American Airlines Group IncThe last 4 years have been brutal for American Airlines. That’s about to change, time to get onboard (I’ll get me coat… )
On the above 10-day chart price action has collapsed 70%. A number of reasons now exist to be bullish, including:
1) Price action resistance breakout.
2) A ‘incredible buy’ signal prints.
3) RSI resistance breakout. Followed by the RSI falling wedge breakout. Excellent.
4) A Dragonfly DOJI candle printed on the monthly chart (below) as price action consolidates within a falling wedge pattern.
Is it possible price action falls further? Sure.
Is it probable? No.
Entry: $20 and above.
Stop: $16
Target: $34
Good luck!
WW
Monthly chart

AAL BUTTERFLY PLAYOpened position on AAL
AAL(DELAYED)
APR 14 STO $18C Ratio 2:1
APR 14 BTO $19C Ratio 1:1
APR 14 BTO $17C Ratio 1:1
Playing credit premium(NOT HOLDING LONG)
Max Gain-$79
Max Loss- $10
This is not financial advice

AAL POSSIBLE SHORT OPPORTUNITYWe can see the price touch the horizontal resistance and 200 EMA. Stochastic oscillator shows overbought market conditions. Therefore, we are expecting the price to drop and make another lower low, however we recommend taking profit at 12,71 $ .
Invalidation above 19,60 $

American Airlines to take offI expect airlines to reverse somewhere from current levels. Going up for months, at least up to the summer.
My ideas are mostly based on technical analysis and few fundamentals, but I don't follow specific indicator.
I have some know-how by looking across several indicators. Of course, I might be wrong as well.
Forecasting bottoms and tops, not target levels or price path.
Don't forget to enjoy your day:)
Disclaimer:
This is my personal journal, not investment advice for anyone.

AAL dropAAL could drop if it rejects my trend line. It's been trading between an upward trend and a lower trend in a channel. If it can't break above the channel, I see a good failure here.
