AMAZON: Small pullback expected. Buy the dip.Amazon is trading inside a Channel Up on the 4H timeframe, supported by both the 4H MA50 and the 4H MA200 and almost overbought on its 1D technical outlook (RSI = 68.804, MACD = 6.500, ADX = 38.620). The 4H RSI is printing a sideways pattern which was a sell signal when the previous bullish waves peaked. The first pulled back to the 0.382 Fib, the second to the 0.5 Fib. Consequently we expect a quick pullback here but technically the dip should be bought on the 0.382 Fib. Our target after that will be near the top of the Channel (TP = 230.00).
See how our prior idea has worked out:
## If you like our free content follow our profile to get more daily ideas. ##
## Comments and likes are greatly appreciated. ##
AMZ trade ideas

AMZN Approaching Key Resistance: Potential Breakout. Nov. 14, 24Amazon (AMZN) has been climbing steadily and is now testing a significant resistance level. Let’s dive into the supply and demand zones, price action, MACD, volume, and EMA indicators to spot actionable levels for scalping and swing trades.
Market Structure Overview:
AMZN is in an uptrend, approaching a strong resistance level around $215. The recent bullish momentum suggests a potential breakout, but with resistance nearby, a pullback could also occur. AMZN’s positioning near its highs makes this a critical area to watch.
Key Zones:
Demand Zone (Support): $210.74 - $212.00
This area has consistently attracted buyers, providing immediate support. If AMZN retraces to this level and shows signs of holding, it could be a great entry point for a long position.
Supply Zone (Resistance): $214.30 - $215.09
This range represents resistance, where previous attempts to break higher have faced selling pressure. A breakout above $215 with volume would signal bullish continuation, while rejection at this level could result in a pullback.
Order Block Insight:
An order block is visible around $212-$213, where institutional interest seems active. Reactions at this level could guide short-term trades, especially for scalpers watching for breakouts or bounces.
Support & Resistance with Entry, Exit, and Stop Suggestions:
Immediate Support: $212
Long Entry: Around $212 if there’s a bounce, targeting exits at $214 and $215.
Stop-Loss: Below $210 to manage risk if AMZN breaks lower.
Immediate Resistance: $215
Short Entry: Near $215 if resistance holds, with targets at $213 and $212.
Stop-Loss: Above $216 to limit potential losses if a breakout occurs.
Swing Trade Setup:
Swing Long: Above $215.09, targeting $218 and $220 if momentum sustains.
Stop-Loss: Below $214 to control risk if the breakout fails.
Swing Short: Below $210, aiming for $205 as the next support level.
Stop-Loss: Above $212 to manage risk if AMZN reverses.
Price Action Insights:
AMZN’s recent move toward $215 reflects strong buying interest, but the price action shows a slight hesitation near this level. A confirmed breakout above this range could signal a bullish continuation, while a rejection could see the stock retrace to the $212 support zone.
MACD and Volume Analysis:
MACD: The MACD shows a bullish crossover with a positive histogram, indicating upward momentum. This aligns with the potential for a breakout if AMZN clears $215 with strong volume.
Volume: Volume has increased during the recent uptrend, supporting the price action. Higher-than-average volume near $215 would add confidence to a breakout scenario. Low volume, however, may result in a lack of follow-through, increasing the chance of a pullback.
9 EMA & 21 EMA Analysis:
9 EMA: AMZN is trading above the 9 EMA, indicating short-term bullish momentum. If the price stays above this level, it suggests continued strength, making it a good signal for scalpers.
21 EMA: The 21 EMA is below the 9 EMA, confirming the uptrend and providing additional support. As long as AMZN remains above both EMAs, bullish momentum should persist.
Scalping & Swing Outlook:
Scalping: Look for quick long entries around $212 for bounces toward $214 or $215. For short scalps, $215 provides a resistance zone to play with a pullback toward $213. Tight stops are recommended given the current volatility.
Swing: A breakout above $215 with volume would favor swing longs, aiming for higher price targets. On the other hand, a break below $210 would open the door for short opportunities targeting $205.
Directional Thoughts & Suggestions:
AMZN’s current setup suggests a slight bullish bias if it can break through $215. My suggestion is to watch for a potential breakout above $215.09, targeting $218 if momentum holds. However, if AMZN fails to break this level and volume dries up, a short-term pullback toward $212 or $210 becomes more likely.
Conclusion:
AMZN is at a critical resistance level, with setups for both bullish and bearish moves. Scalpers and swing traders should monitor the price action and volume closely around $215. Keeping tight stops and observing reactions at these levels will be crucial to managing risk effectively.
Disclaimer: This analysis is for educational purposes only and not financial advice. Please conduct your own research and consult with a financial advisor. Trading involves risks, and past performance does not guarantee future results.

AMAZON Minor pull-back and then off to $240.Amazon Inc. (AMZN) has been following our bullish signal within the Channel Up we indicated on August 23 (see chart below) very accurately and is halfway through to our $240.00 long-term Target:
This is also confirmed on the lower time-frames, namely the 1D on this chart, where the stock can be seen trading within a Channel Up and having started its most recent rebound on the 1D MA50 (blue trend-line).
The first Bullish Leg of the Channel Up, pulled-back to the 1D MA50 (and Fib 1.0) after approaching the 1.382 Fibonacci extension level and then rebounded aggressively to hit (and even break) the 2.0 Fibonacci extension. Even the 1D CCI sequences between the two fractals are quite similar.
As a result, we don't dismiss the possibility of a 1D MA50 pull-back but that will be another buy opportunity on Amazon's way to $240.00.
-------------------------------------------------------------------------------
** Please LIKE 👍, FOLLOW ✅, SHARE 🙌 and COMMENT ✍ if you enjoy this idea! Also share your ideas and charts in the comments section below! This is best way to keep it relevant, support us, keep the content here free and allow the idea to reach as many people as possible. **
-------------------------------------------------------------------------------
💸💸💸💸💸💸
👇 👇 👇 👇 👇 👇

AMZN: Rising Wedge Formation with Key Support and Resistance📌 Overview
Amazon Inc. (AMZN) appears to be forming a rising wedge pattern on the 1-hour chart, typically signaling potential bearish reversal if support levels do not hold. Current price action is testing significant resistance levels, and the 9 EMA and 21 EMA are in play to provide momentum signals. Let’s analyze the key levels, indicators, and potential trade setups.
📊 Current Trend on the 1-Hour Chart
The 1-hour chart shows a series of higher lows, with price moving upward in a narrowing range, forming a rising wedge pattern. This setup often indicates a potential bearish reversal, especially if price fails to break above resistance.
Short-term bullish momentum is present, but there are signs of slowing as the price approaches resistance zones.
📉 Key Levels
Resistance Levels:
$212.25: The most recent high and an important resistance level. A breakout above this level, particularly with volume, could suggest bullish continuation despite the rising wedge structure.
$210.68 - $209.00: The ask price at $209.00 and nearby resistance at $210.68 are key zones where price has been struggling. A rejection here could lead to a pullback to lower support levels.
Support Levels:
$205.62: This is a critical support level and the lower boundary of the rising wedge pattern. A breakdown below this level, especially with volume, could trigger a bearish move.
Trendline Support: The upward trendline from the wedge formation is another potential support area. If price respects this line, it could provide short-term bullish support, but a break below would reinforce bearish sentiment.
🔄 Indicators
9 EMA and 21 EMA:
The 9 EMA (faster-moving) and 21 EMA (slower-moving) are converging, suggesting a potential shift in momentum. If the 9 EMA crosses below the 21 EMA, it would add to the bearish case, while a cross above could support a bullish breakout.
MACD:
The MACD shows signs of weakening momentum, with the histogram flattening and a potential bearish crossover forming. This aligns with the possible reversal signal from the rising wedge pattern.
Volume:
Volume has been decreasing as AMZN approaches the resistance zone, a typical signal in wedge formations. A volume spike upon breakout or breakdown will be crucial in confirming the direction of the next move.
🛠 Trade Setup
Bearish Scenario:
If AMZN breaks below $205.62, it could indicate a breakdown from the rising wedge pattern, suggesting potential downside. In this scenario, a target could be around $202, with further downside possible if selling pressure persists.
Bullish Scenario:
A breakout above $212.25 with increased volume would invalidate the wedge’s bearish potential, signaling bullish continuation. In this case, targets would be $215 and higher.
⚠️ Risk Management
Stop-Loss: For a bearish entry, consider a stop-loss above $210.68. For a bullish trade, place a stop-loss below the lower trendline or $205.62 to limit losses if the wedge breakdown occurs.
Position Sizing: Adjust position size according to risk tolerance, as a breakout or breakdown can bring significant volatility.
📚 Key Takeaways
AMZN is in a rising wedge pattern on the 1-hour chart, typically a bearish setup.
Key levels to watch include $212.25 for resistance and $205.62 for support, with the 9 EMA and 21 EMA giving additional trend clues.
Volume and MACD will be essential for confirming any breakout or breakdown.
💬 Conclusion
Amazon Inc. (AMZN) is at a critical juncture with a rising wedge pattern on the 1-hour chart, indicating possible bearish pressure if support fails. Traders should monitor volume and EMA crossovers to confirm the next move, whether it’s a breakout or breakdown.
Disclaimer:
This analysis is for educational purposes only and should not be considered financial advice. Conduct your own research or consult with a financial advisor before making trading decisions.

Amazon Stock (AMZN) Holds Above $200Amazon Stock (AMZN) Holds Above $200
On Thursday, October 31, Amazon released its Q3 earnings report:
→ Earnings per share: actual = $1.43, forecast = $1.14;
→ Gross sales: actual = $158.8 billion, forecast = $157.2 billion.
The report exceeded analyst expectations, with additional optimism driven by Trump’s victory and a Fed rate cut, pushing Amazon’s stock price past the psychological $200 mark and reaching a new high above $210.
Today, Amazon’s stock chart shows the price beginning to round off (indicated by an arrow). Does this signal the end of the bullish trend?
Unlikely, given the strong fundamental support. In technical terms, it may be more accurate to consider the price’s vulnerability to a correction, especially as it sits near the upper boundary of an ascending channel.
Should a correction occur, a retest of the $200 level is possible. Support may come from the median line of the long-term blue channel or the lower boundary of the short-term black channel.
According to TipRanks, which surveyed 45 Wall Street analysts:
→ 44 analysts recommend buying AMZN stock;
→ On average, they forecast a 12-month price target of $238.
This article represents the opinion of the Companies operating under the FXOpen brand only. It is not to be construed as an offer, solicitation, or recommendation with respect to products and services provided by the Companies operating under the FXOpen brand, nor is it to be considered financial advice.

amazonTLDRForming good software development habits can significantly enhance speed and maintain quality. Key practices include making small commits, continuous refactoring, prioritizing working software, creating new modules for disparate functions, and focusing on test-driven development (TDD) to anticipate edge cases. Avoid

AMZN tomorrow@nuxtandvue
Hey there! Welcome to The Looop Tech - Vue.js. I’m your host IGC , your friendly neighborhood Vue.js enthusiast! Join me each week as I chat about the latest Vue.js news, share fun tips, and dive into all things Nuxt.js. It’s just me here, so if you’

Amazon (AMZN) Long Side Analysis: Staying Bullish with CautionHey Again Folks!
Just wanted to share some thoughts on Amazon (AMZN) — I’m still leaning on the 🔵 long side here, but keeping a close eye on a few key levels.
Right now, AMZN is sitting around the $206-210 range, and it’s getting close to that resistance up at $213 🟢. This has been an important level before, so I’m watching to see if we can push through it with some strength 💪.
If we get a strong breakout above $213 🔥, I think the next target to watch is around $236 📈. That area lines up with previous highs and could be the next stop if this momentum keeps up. But if we hit resistance and start pulling back, I’ll be watching the lower boundary of the channel and especially the $190 zone for support 🛠️.

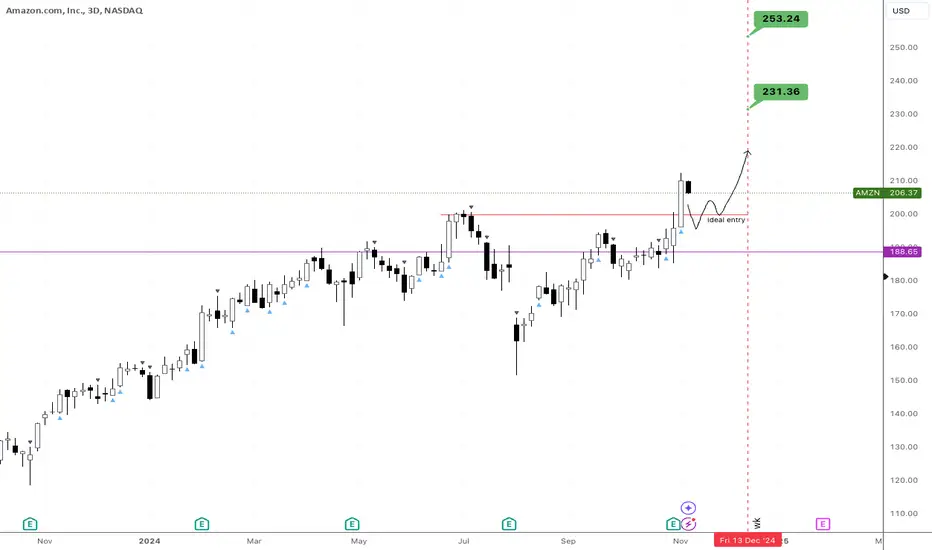
Prime'd for Profits: Amazon at Price DiscoveryNASDAQ:AMZN is currently trading at price discovery. Last weekly candle closed with lots of strength above precious all time high. Any retrace is a chance to jump in and increase our positions.
Bullish time at mode trend has just been confirmed.
- Expiry is set for mid December
- Targets of $231 and $253's at first .
- Entry dca at low $200’s to $180's
Amazon Prepares for Strong Holiday Season GainsAmazon has recently reached new all-time highs, signaling robust
performance fueled by strong consumer demand as we approach the holiday season.
The stock has traded above the critical $200 level, demonstrating strong
momentum that positions it well to capitalize on winter sales activity. However,
valuation concerns linger due to its high-profile status alongside companies
like Apple, which could temper enthusiasm in the broader market context.
- Key Actionable Insights: Investors should monitor Amazon's ability to maintain
its upward trajectory, particularly as it approaches resistance levels around
$230-$250. With the upcoming holiday sales expected to boost revenues, now is a
critical time to evaluate entry points. Set alerts for price movements
surrounding these key levels and consider taking action if favorable trends
continue.
- Sentiment Analysis: The current sentiment for Amazon stands at 45.95,
reflecting a 3.69-point increase from last week's sentiment of 42.26. With total
mentions across sources at 22, this positive shift suggests a growing bullish
perspective among analysts and traders, indicating potential investor confidence
in Amazon's performance.
- Summary of Expert Opinions: Experts remain optimistic about Amazon's outlook,
particularly given the recent partnership with AWS and Anthropics to strengthen
its AI capabilities. Analysts cite the company's strong position for holiday
season sales and a projected price target boost to around $230, signifying that
the stock could continue to thrive even amid broader market volatility.
- Technical Levels: Based on the wisdom of all professional traders, immediate
target levels for Amazon are set at $220 (target 1) and $250 (target 2), with
recommended stops at $205 (stop 1) and $200 (stop 2). Longer-term ambitions
include a target of $250, expected within the next few weeks as the holiday
shopping season ramps up.
- Notable News: Recent headlines highlight Amazon's expected strong performance
during the holiday season, alongside Jeff Bezos's substantial stock sale, which
has raised some eyebrows regarding insider confidence. Additionally, the
integration of advanced AI strategies positions Amazon as a competitive player
in the tech space, further solidifying its market viability going forward.

AMZN Technical Analysis for Nov.11, 20241. Trend and Price Channels
Looking at the 1-hour chart, AMZN is in a strong upward channel. The stock recently tested a high of around $212.25, but has since pulled back slightly. The support line on this upward channel is holding well, keeping the bullish momentum intact. We should watch for a break above $212.25 for continuation, with the next potential target around $215 if the momentum sustains.
2. Moving Averages (EMA)
The short-term EMAs, such as the 9 and 21 EMA, are showing a steady upward slope, reflecting strong bullish sentiment. As long as AMZN remains above these EMAs, the trend should stay positive. For scalpers, buying near the 9 EMA could offer good entry points in an uptrend, but a close below the 21 EMA might suggest caution as it may indicate a pullback.
3. Momentum and Volume
The recent rally was supported by decent volume, but volume has tapered slightly. This reduction could signal a cooling period or consolidation. The MACD and RSI (not shown here) can provide further insights. For a short-term view, if MACD shows bearish divergence or if RSI enters overbought territory, it could mean a pullback is imminent. Swing traders should consider entering after a confirmed breakout above recent highs with strong volume to minimize risk.
4. Key Support and Resistance Levels
Immediate Support: Around $208.20 (current bid level)
Secondary Support: Near $200.34
Resistance to Watch: $212.25 (current high); beyond that, look for $215
Trade Suggestions
Scalping: For scalpers, consider entering long positions on pullbacks to $208 - $209 with a target back toward $212. If price action shows weakness near $212, shorting briefly could be viable, but this is higher risk given the overall uptrend.
Swing Trading: If AMZN breaks above $212.25 with strong volume, consider a swing trade targeting $215 or higher. A break below $200 could signal a deeper pullback or consolidation, so manage risk accordingly.
Disclaimer: This analysis is for educational purposes only and should not be considered financial advice. Always perform your own research or consult with a financial advisor before making trading decisions.

Break and retest of ATH's for AMZN?🔉Sound on!🔉
Thank you as always for watching my videos. I hope that you learned something very educational! Please feel free to like, share, and comment on this post. Remember only risk what you are willing to lose. Trading is very risky but it can change your life!

AMZN Poised for Breakout or Pullback? Key Levels to Watch!Analysis:
Channel Trend:
AMZN has been trading within an ascending channel, showing a consistent upward trend over the past week. The price recently tested the upper trendline of the channel, indicating strong bullish momentum but also a potential point of exhaustion.
Volume Analysis:
Volume has been decreasing slightly during the most recent rally, suggesting possible weakening buying pressure. Watch for a volume spike as confirmation of a breakout or potential reversal.
Moving Averages:
The 9 EMA and 21 EMA are providing dynamic support, with the price currently trading above both. This indicates strong short-term bullish sentiment. However, a break below these EMAs could signal a potential pullback.
Key Support and Resistance Levels:
Immediate Resistance: $212.25 (Recent high and upper channel boundary)
Support Levels:
First Support: $204.41 (previous breakout level)
Second Support: $200.43 (psychological and strong support zone)
Critical Support: $197.57 (breakdown level below which the bearish sentiment could accelerate)
MACD Analysis:
MACD is currently bullish, but the lines are converging, hinting at potential momentum loss. A bearish crossover could indicate a pullback or consolidation phase.
Price Action Expectation:
Bullish Scenario: If AMZN breaks above $212.25 with increased volume, it could test the next psychological level of $215. Monitor the breakout and watch for a retest of the upper channel as confirmation.
Bearish Scenario: Failure to hold above $204.41 could lead to a pullback towards $200.43, where buyers may step in. A break below $197.57 could shift the momentum to the downside.
Conclusion:
Given the broader market rally over the last two days, AMZN may continue its upward momentum. However, traders should watch for potential resistance at the upper trendline and be prepared for a possible pullback, especially if volume does not support the current rally.
Disclaimer:
This analysis is for educational purposes only and should not be considered financial advice. Please perform your own research or consult with a financial advisor before making trading decisions.

AMZN pullback to $196MODs have suggested that I provide more detail about the picks I make.
Sorry. I'm not as verbose as y'all, and I don't like things to be complicated.
My trading plan is very simple.
I buy or sell at top & bottom of parallel channels.
I confirm when price hits Fibonacci levels.
Bonus if a TTM Squeeze in in play.
I hold until target is reached or end of year, when I can book a loss.
So...
Here's why I'm picking this symbol to do the thing.
(Buy puts or buy AMZD)
Price at top of channels (period 100 52 39 & 26)
Stochastic Momentum Index (SMI) at overbought level
VBSM spiked positive
Price at Fibonacci level
In at $205.25
Target is $196 or channel bottom
Stop loss is $208

Amazon: Significant Breakout!The resistance at $189.76 has recently been a major hurdle for the AMZN stock. Since April, the price has essentially been moving sideways along this level, with each breakout attempt being sold off. As envisioned by our primary wave count, the stock has now managed a breakout above $189.76, developing a first impulsive move toward a new all-time high. We expect a more substantial correction only after the larger beige wave III has found its top at a higher level. An earlier sell-off remains possible as part of our 30% likely alternative scenario: this alternative count suggests that the recent peak was the top of the beige alt. b wave, which would lead to a pullback below $145.86 and a fresh low of the overarching blue wave alt. (IV).

AMZN Today Nov. 7, 2024Price Action & Trend:
Amazon is following an ascending channel pattern with a series of higher highs and higher lows, suggesting a strong uptrend.
The price is near the top of the channel, indicating potential resistance. If it breaks above this channel on high volume, it may continue the bullish momentum. Otherwise, it could face selling pressure and move back down toward the lower trendline.
Key Levels:
Resistance: Around $208. This level is just under the top of the channel, so it may act as a strong resistance zone. A breakout above $208 with solid volume could indicate further upside potential.
Support: Around $200 - This is the first support level within the channel and a potential area where buyers might step in on a pullback.
Lower Support Zone: Around $197 and $194 - These levels serve as additional support in case of a deeper pullback.
Volume & Momentum:
Volume seems to increase on upward moves, supporting the bullish trend. However, it’s crucial to monitor for potential volume decline if AMZN tests the resistance.
MACD shows potential overbought conditions, indicating a chance for a pullback or consolidation. Watch for a bearish divergence if momentum weakens near the channel top.
Potential Scenarios:
Bullish: If Amazon breaks above $208 with significant volume, it may continue to rise. Intraday traders could consider entering on a confirmed breakout, targeting further upside within the channel's extension.
Bearish: If AMZN is rejected at the $208 resistance, it could drop to the $200 level or lower support zones, presenting potential shorting opportunities on rejections at resistance or a breakdown below $200.
Disclaimer
This analysis is for informational purposes only and is not financial advice. Always do your own research or consult a financial professional before making trading decisions. Trading involves risks, and past performance is not indicative of future results.

AMZNI was short on amzn a few weeks ago, obv closd that position at a loss...
Looks like Amazon just broke out of a wedge pattern and is on the move. I’m in with $215 strike calls, targeting $217 in the short term. If this momentum keeps up, we could see it push into the $230s by the end of the month—that would be a nice bonus!

$AMZN IS ABOUT TO EXPLODE! BUY NOW OR FOMO LATERNASDAQ:AMZN
💥 NASDAQ:AMZN IS ABOUT TO EXPLODE! 💥
I first called out NASDAQ:AMZN on October 21st as it was setting up for a huge move and CupnHandle breakout. Here's 3 reasons to not miss this investing or trading opportunity. Price targets at the end.
1.) HIGH FIVE SETUP (Check the numbers below and you will see. 1-Breaking out of cupnhandle & symmetrical triangle pattern. 2-Volume profile gap from a volume shelf. 3-Uptrending MACD. 4-Higher Highs on RSI. 5-Uptrending Stoch. (trend).
2.) #Amazon margins and FCF are growing rapidly and will continue this uptrend heading into the holiday season with a RESILIENT AMERICAN CONSUMER.
3.) It's a BUY according to the fundamentals especially when valuing this company according to it's Discounted Cash Flow (DCF).
Intrinsic Value: $250
🎯PT1: $231 (Symmetrical triangle measured move)
🎯PT2: $310 (Multi-year CupnHandle Measure Move)
Are you a shareholder? or Are you trading this name?
I'm done for the day! Going to be with my wife on her birthday and go trick or treating with my boys. Thanks for all the support, much love!
LIKE l FOLLOW l SHARE
HAPPY HALLOWEEN!
#Earnings
NFA

AMZN Short Shorting AMZN right here at ATH, brings a good r:r and on the weekly timeframe RSI is down.
Targeting the gap at 191 as final target, will take profits going down.
Daily close above ATH with volume will invalidate the idea
R:R 4.5

Amazon (AMZN): Approaching critical resistance!Amazon continues its impressive rise, moving out of our initial sharp Wave (2) scenario. Despite the bullish momentum fueled by last Thursday’s earnings report, we remain cautious and are still leaning towards a potential larger pullback. The company showed strong performance in key segments, with CEO Andy Jassy’s strategic focus on expenditure and cost-cutting delivering an 11% revenue increase to $158.9 billion, surpassing analysts’ expectations.
Now, Amazon has reached our second key turnaround zone, between $201 and $220. A move higher would invalidate our bearish outlook, but until then, we are preparing for a potential pullback and targeting lower entry points to capitalize on future upward swings. The stock has recently posted a nearly perfect equal high, alongside a bearish divergence, which could signal an upcoming correction.
The looming U.S. elections could inject significant volatility into Amazon’s price action, with potential wicks forming in either direction. While a move up to $220 would still be considered valid within this structure, we are closely monitoring these levels. As always, we will update you once the bearish scenario is confirmed or invalidated.

AMAZON | AMZN , Jeff is back? While Jeff Bezos, fiancée Lauren Sánchez have star studded engagement party on his $500M yacht Amazon has just reported its Q2 2023 earnings result, EPS of 65 cents is not comparable on YoY basis nor to consensus due to the company booking some gains related to its Rivian Automotive, Inc (RIVN) investment. Revenue of $134.3 billion beat consensus by about 2% while showing a YoY jump by nearly 11%. As an immediate reaction, the stock is up nearly 8% after-hours, although this can turn on a dime.I wrote in my preview that Amazon still remains a revenue story and to pay attention to Q2's actual revenue and Q3's revenue guidance. Amazon hit it out of the park on both counts, with Q2 revenue showing an 11% jump and Q3 guidance of $138 billion to $143 billion, easily upping the consensus of $138.29 billion.
As a direct effect of the company reining in on its expenses, Amazon's Free Cash Flow ("FCF") in Q2 2023 improved to almost $8 billon compared to -$23.5 billion in Q2 2022. Headcount is now down 4% YoY.Advertising, which I've highlighted as the next growth driver in many of my past articles, was up 22% YoY. But, more importantly, resumed its upward trajectory on a quarterly basis. Advertising services revenue showed continuous QoQ improvement until the first blip in Q1 2023. Whether Q2's upsurge is a new trend remains to be seen, but it is encouraging that Q2 did not follow Q1 down. I am also glad that my prediction that advertising will cross $10 billion in sales came true.It appears like retail has finally stopped bleeding profusely to avoid wasting all the gains from AWS and Advertising. In my view, retail is just their medium to sell their ecosystem, and this is acceptable to me.
Heading into earnings, Amazon stock was almost into the oversold territory with a Relative Strength Index ("RSI") of 37. Revenue beat and guidance should help the stock garner more analyst support in the upcoming days, and I fully expect the stock's almost-oversold conditions to be in the stock's favor as it has plenty of room upwards technically. The after-hours move has also helped the stock clear all of the commonly used moving averages.AWS's revenue and operating income appeared to be on a perennial, mid-double-digit growth trajectory until recently. However, Q2 saw AWS' sales increase by "just" 12% while operating income fell by more than 5%. It is in this context that advertising services becomes even more important. While $22 billion is strong, it fell well short of the $25 billion I predicted, as the company aims to cross $100 billion in 2023 AWS revenue.
The stock was already up 50% YTD heading into earnings and the run appears set to continue. I am not complaining as a long, but it shouldn't surprise anyone to see the stock pullback from the highs given the market's shaky behavior the last few days.
Overall, Q2 results are much better than Q1, and that shows in the stock's performance, at least as shown in the after-hours price movement. However, Amazon has never been a single quarter or single year story for me. Amazon's ecosystem is enough reason for me to continue believing in the company long-term. The ability to leverage multiple products and services across the entire organization is not something any company can build overnight. In fact, even Amazon has taken nearly 30 years to be the company that it is today

Be careful with Amazon !!!In my opinion, the shares of this company should be 1.5% lower than the current price, which means at $186.5 .
So, any correction in the shares of tech giants is an opportunity for investment entry....
✨We spend hours finding potential opportunities and writing useful ideas, we would be happy if you support us.
Best regards CobraVanguard.💚
_ _ _ _ __ _ _ _ _ _ _ _ _ _ _ _ _ _ _ _ _ _ _ _ _ _ _ _ _ _ _ _
✅Thank you, and for more ideas, hit ❤️Like❤️ and 🌟Follow🌟!
⚠️Things can change...
The markets are always changing and even with all these signals, the market changes tend to be strong and fast!!

Amazon is up over $140BAmazon is up over $140B overnight. For perspective, that's the entire market-cap of $SCHW. Also more than the entire value of $NKE. Amazon represents 22% of entire Consumer Discretionary Index. It's 5% of NASDAQ:QQQ and newest member of the DJ Industrial Avg
