Cup with handlethe graph is acting through like cup with handle formation. I predict if graphs finish the handle, we must see serious attack from amazon. lets see how it is being end.
AMZ trade ideas

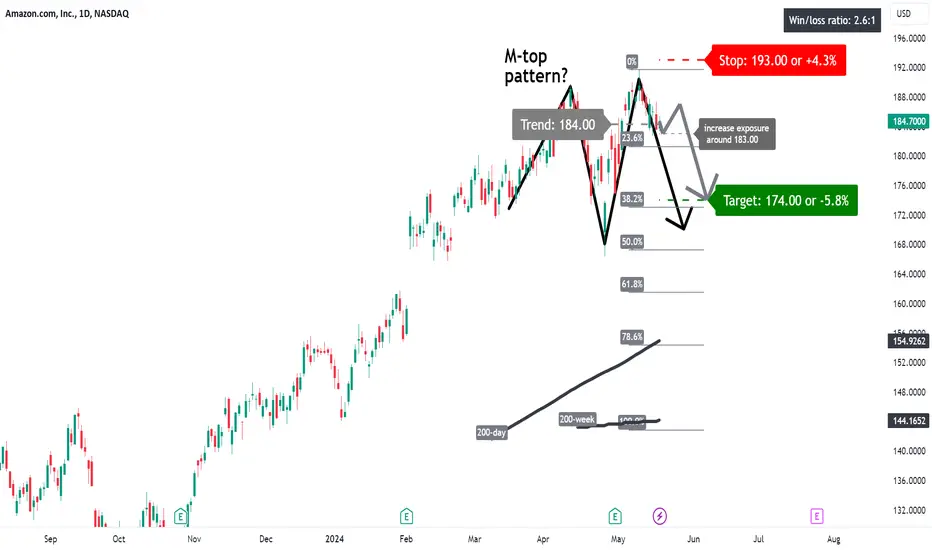
AMZN: M-top pattern?A price action below 184.00 supports a bearish trend direction.
Increase short exposure for a break below 183.00.
The target price is set at 174.00 (its 38.2% Fibonacci retracement level).
The stop-loss price is set at 193.00 (the start of the retracement).
It will appear that an M-top pattern is busy developing.
Remains a risky trade.
AMZNPair : AMAZON
Description :
Completed " 12345 " Impulsive Waves
Break of Structure
RSI - Divergence
Double Top in Short Time Frame
Fibonacci Level - 261.8%

AMZN heads up at $187.49: last strong resistance before 200This is a follow up to my $177 breakout call (click).
Nearing a significant resistance around $188.
Expecting a pullback but the market is strong.
At the least we should get some sideways action.
$ 187.49 - 188.98 is the immediate resistance of interest.
$ 197.94 - 199.63 is next major resistance and maybe top.
$ 181.95 - 182.39 is first good support that bulls must hold.
=====================================================
.

Red Flags on Amazon chartThe Amazon chart is showing several concerning signs. Although Amazon recently reached a new all-time high, this achievement wasn't supported by the daily Relative Strength Index (RSI), indicating a clear divergence on this indicator. This divergence suggests a loss of upside momentum at a critical juncture - namely around the 2021 peak at 188.65.
Additionally, on the daily chart, the market has been unable to breach the top of its daily Bollinger band. Even a retreat back to the lower end of the Bollinger band could lead to a decline towards 172, signaling a notable setback.
At the very least, it's advisable to tighten up stops on long positions.
Disclaimer:
The information posted on Trading View is for informative purposes and is not intended to constitute advice in any form, including but not limited to investment, accounting, tax, legal or regulatory advice. The information therefore has no regard to the specific investment objectives, financial situation or particular needs of any specific recipient. Opinions expressed are our current opinions as of the date appearing on Trading View only. All illustrations, forecasts or hypothetical data are for illustrative purposes only. The Society of Technical Analysts Ltd does not make representation that the information provided is appropriate for use in all jurisdictions or by all Investors or other potential Investors. Parties are therefore responsible for compliance with applicable local laws and regulations. The Society of Technical Analysts will not be held liable for any loss or damage resulting directly or indirectly from the use of any information on this site.


AMZN - Day trading, Head & Shoulder pattern, bearing formationAMZN - Day trading, Head & Shoulder pattern, bearing formation for target 183

Amazon boosts investment in Singapore's cloud infrastructureAmazon Web Services (AWS) has announced a robust investment plan, committing 12bn SGD (approximately 8.88bn USD) over the next four years to bolster the cloud infrastructure in Singapore. This initiative marks a significant move by Amazon to solidify its presence in Southeast Asia, a region renowned for its rapidly expanding economies and tech-savvy population of 670 million. This investment underscores the strategic importance of Southeast Asia as a pivotal battleground for tech giants vying for market dominance.
The region's allure for tech corporations extends beyond its large population. It features dynamic economic growth and a business-friendly climate. Analysts anticipate fierce competition among providers of artificial intelligence services, with success likely to hinge on innovation, pricing strategies, and adherence to local regulations.
Analysing the investment implications, let's review the technical analysis for Amazon.com Inc. (NASDAQ: AMZN):
In the Daily (D1) timeframe, the stock has identified resistance at 189.95 USD and support at 176.55 USD. Following a recent correction, the stock has resumed its upward trajectory, indicating potential for reaching new historical highs. Should this trend reverse, the stock could retreat to a lower target of 165.00 USD.
For traders, a continuation of the uptrend with a breakthrough above the resistance level at 189.95 USD offers a potential buying opportunity, with a short-term price target of 200.00 USD. From a medium-term perspective, the price could ascend to 215.00 USD if the upward momentum is sustained.
—
Ideas and other content presented on this page should not be considered as guidance for trading or an investment advice. RoboMarkets bears no responsibility for trading results based on trading opinions described in these analytical reviews.
The material presented and the information contained herein is for information purposes only and in no way should be considered as the provision of investment advice for the purposes of Investment Firms Law L. 87(I)/2017 of the Republic of Cyprus or any other form of personal advice or recommendation, which relates to certain types of transactions with certain types of financial instruments.
Risk Warning: CFDs are complex instruments and come with a high risk of losing money rapidly due to leverage. 69.88% of retail investor accounts lose money when trading CFDs with this provider. You should consider whether you understand how CFDs work and whether you can afford to take the high risk of losing your money.

Looking for a nice swing call on amazon soon! 🔉Sound on!🔉
Thank you as always for watching my videos. I hope that you learned something very educational! Please feel free to like, share, and comment on this post. Remember only risk what you are willing to lose. Trading is very risky but it can change your life!

AMZN Short: Potential Ending Diagonal on Price-Volume DivergenceThis is a short call that I had forced the last wave up to be an "ending diagonal". The reason for doing so is because of the price-volume divergence that is shown on the daily timeframe when AMZN was making a new high.
For those who are familiar with "Ending Diagonal", the imperfection will to be pointed out is"
"Wave 1" did not show clear 3 waves.
"Wave 2" is irregular.
As I admitted on the first paragraph, I did FORCE this count to show a possibility. Thus the stop loss is very tight: just above the high. The first take profit target will be where the wave 4 of a higher degree ends.


Amazon Set to Launch Dedicated Online Store in Ireland in 2025Amazon ( NASDAQ:AMZN ) has announced its intention to launch a dedicated online store in Ireland in 2025. This move, according to the company, will provide Irish customers with a wide selection of great value products with fast delivery, while also offering opportunities for small- and medium-sized Irish businesses to reach a bigger audience at home and abroad. Amazon.ie will offer more products from Irish businesses, low, local prices, and no additional customs charges.
The new store will provide an enhanced experience for both new and existing customers by delivering a localized shopping experience to those who already shop on Amazon stores in other countries. Furthermore, the company stated that more than 1,000 Irish businesses already sell on Amazon and generated over 150 million euros (about $162 million) in export sales in 2022.
Amazon ( NASDAQ:AMZN ) currently employs 6,500 people in Ireland, including data engineers, operations management, finance, and other roles. The company has also invested more than 17 billion euros (about $18 billion) in the country since 2020 and launched its first fulfillment center in 2022. Additionally, Amazon signed a five-year agreement with An Post in 2023 that will make deliveries and returns faster and easier.
In a related announcement, Amazon ( NASDAQ:AMZN ) stated that it is heading into its 25th year of offering Amazon Marketplace, its online experience that offers goods from independent sellers, many of which are small- to medium-sized businesses (SMBs). Launched in 2000, Amazon Marketplace has enabled independent sellers to employ more than 1.8 million people in the United States and has contributed to these sellers now accounting for more than 60% of sales in Amazon's stores.
Technical Outlook
Amazon Inc. ( NASDAQ:AMZN ) stock is up 1.09% trading on its 5th wave on the Bullish Divergence pattern. Since December 2023 Amazon ( NASDAQ:AMZN ) stock has started a Bullish divergence pattern going through 6 months now. Hence, traders ought to be cautious of a Bearish Reversal looming ahead.

Volume Range Mapping Amazon on 1h and 15m for 2minute chartmapping the general levels of amazon for trading on a smaller time frame

Honestly, I may sound crazy - But AMZN possibly $215 before MayBased on my sources and inputs, as well as supporting price action and Volume Price Analysis, i have concluded that while everything else pumps in the bull case, AMZN may be a larger force in a breakout. As per Richard Wycoff, longer consolidation means a larger implied move. AMZN has retested MAs and shown support outside boxes. This thing is primed. Let's see what happens
NFA - Only opinion. Big moves happen so manage your risk and safe.

AMZN - Tech Analysis - $buy the breakoutWhen the charts looked ugly it was a historic buying moment. Amzn fell to the classic fib levels and the sharp edges of the market stepped in.
When the set up looks juicey though... the herd rushes to pile in. Excited to see this one play out.

Resistance and RSIThe stock AMZN opened above the resistance level at $189.75, indicating a potential uptrend. If the RSI indicator stands above the 70 line, it could further confirm the upward trend.

AMZN Ascending Wedge TestAMZN sold off along with most stocks after it broke below a major ascending wedge it had been forming for months. It has already failed once on a retest of this level and tried again today. It looked good to reclaim the wedge, but ultimately sold off and closed nearly right on the trendline. This will be a critical area to watch. I would normally always expect this to fail here, but I'm waiting on some more confirmation from ES and NQ before trying to short anything right now.

Amzn... Fawkery on top of fawkery.. dragging this short out... 2nd rising wedge here should get it done..
Stop loss 192.
1st Target 173
2nd target 160
Mid term target is 173 gap close.
Long term target 160 gap close

AMZN Amazon Options Ahead of EarningsIf you haven`t bought AMZN before the previous earnings:
Then analyzing the options chain and the chart patterns of AMZN Amazon prior to the earnings report this week,
I would consider purchasing the 175usd strike price Calls with
an expiration date of 2024-6-21,
for a premium of approximately $12.95.
If these options prove to be profitable prior to the earnings release, I would sell at least half of them.

A LOVEly set upYes. This is quite the Love-ly set up. Inverse H&S looking good with volume by its side. 200 is POI for take profit. Let's see what happens

$AMZN is forming a rising wedgewe have two scenarios,
it will either hit ~190 before going back to ~165
or hit ~190 and break from previous resistance line at ~190, what do you think ?

Indicator Support Resistance DynamicThe request asks for the translation of a trading strategy using an indicator called "Support Resistance Dynamic," with buy entry points at the first resistance level at a price of 189.77 for an uptrend, and buy entry points at the first support level at a price of 171.47 for a downtrend.
