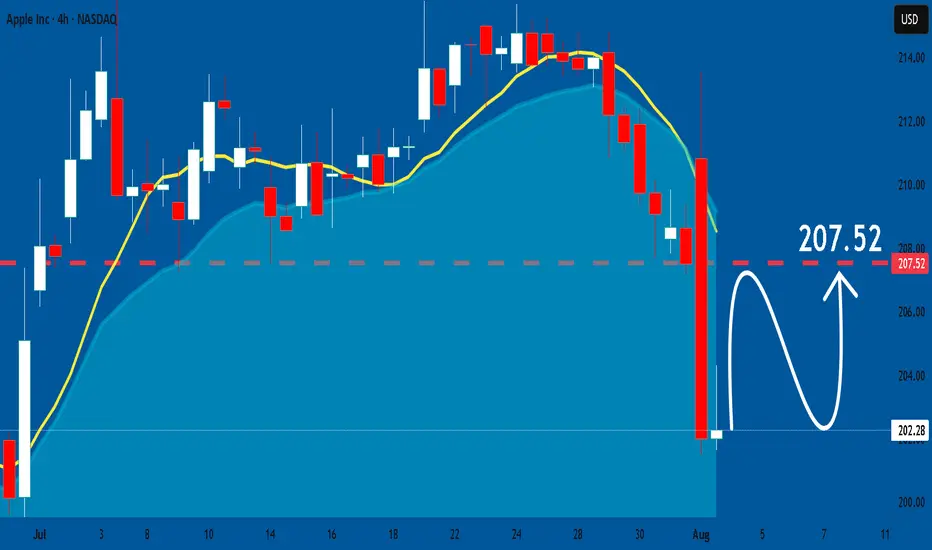
AAPL: 202.38Bullish Entry: 206.00 / 208.00 Stop 202.00 Bullish Target: 210.00 / 213.00
Bearish Entry: 200.00 / 198.00 Stop 202.00 Bearish Target: 196.00 / 194.00
APC trade ideas

APPLE: Bullish Forecast & Bullish Scenario
The charts are full of distraction, disturbance and are a graveyard of fear and greed which shall not cloud our judgement on the current state of affairs in the APPLE pair price action which suggests a high likelihood of a coming move up.
Disclosure: I am part of Trade Nation's Influencer program and receive a monthly fee for using their TradingView charts in my analysis.
❤️ Please, support our work with like & comment! ❤️
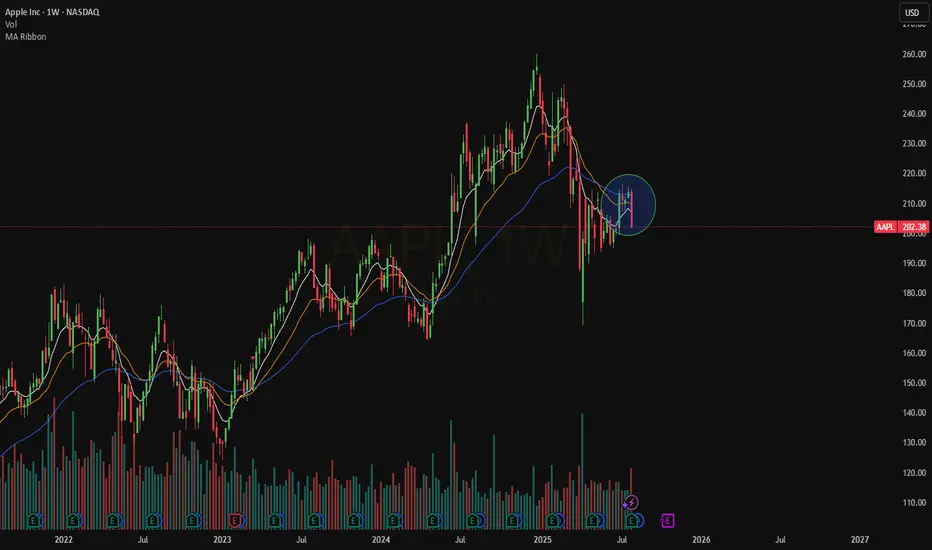
Apple - The next major push higher!🍎Apple ( NASDAQ:AAPL ) will head for new highs:
🔎Analysis summary :
Apple has been underperforming markets for a couple of months lately. However technicals still remain very bullish, indicating an inherent and substantial move higher soon. All we need now is bullish confirmation and proper risk management and this setup looks very decent.
📝Levels to watch:
$200, $300
🙏🏻#LONGTERMVISION
Philip - Swing Trader

Apple (AAPL) Shares Jump Following Earnings ReportApple (AAPL) Shares Jump Following Earnings Report
Yesterday, after the close of the regular trading session, Apple released its earnings report, which surpassed analysts’ expectations:
→ Earnings per share: actual = $1.57, forecast = $1.43;
→ Revenue: actual = $94.04 billion, forecast = $89.35 billion.
As a result, AAPL shares surged in the post-market, rising from $207.57 to $212.51.
Media Commentary:
→ The company reported a 13% year-on-year increase in iPhone sales.
→ However, according to Tim Cook, tariffs have already cost the company $800 million and this figure could exceed $1 billion in the next quarter.
Technical Analysis of the Apple (AAPL) Stock Chart
Following the volatility in April 2025, price action has justified the construction of an ascending channel (marked in blue). The $216 level, which has acted as a key reference point since March, remains a significant resistance area, because:
→ It has consistently prevented AAPL from reaching the upper boundary of the channel;
→ Even in the wake of a strong earnings report, the price failed to break through this level in post-market trading.
If the $216 level continues to cap gains in the coming days – despite the positive report – the stock might pull back towards the median line of the blue channel (following the post-market rally). This zone often reflects a balance between supply and demand. While such a retracement would appear technically justified, it may raise concerns among shareholders, particularly when compared to the more aggressive price rallies seen in the shares of other tech giants, such as Microsoft (MSFT), as we discussed yesterday.
From a more pessimistic perspective, peak A may turn out to be yet another lower high within a broader bearish structure that has been forming on the AAPL chart since December 2024, when the stock reached its all-time high around the $260 level.
This article represents the opinion of the Companies operating under the FXOpen brand only. It is not to be construed as an offer, solicitation, or recommendation with respect to products and services provided by the Companies operating under the FXOpen brand, nor is it to be considered financial advice.

AAPL BUY 1st target $223AAPL is forming a wedge and been lagging for 2 years. I was expecting $182 but we never saw that level, after weeks of $200 range consolidation it's clear this is basing, first target of resistance is $223 then we could be off to the races. I would expect to see this as soon as next week provided #donthecon can stop bullying American companies long enough to focus on important things


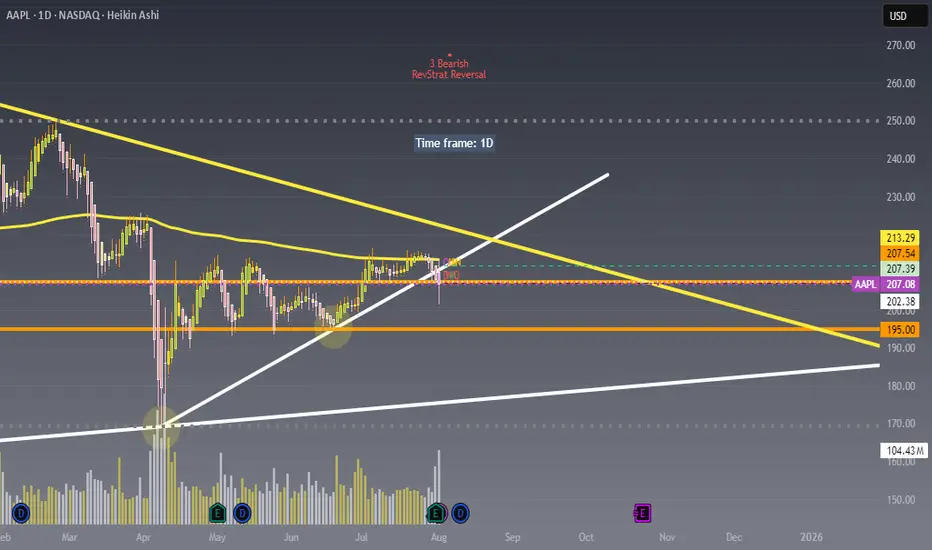
Watching AAPL closely here !!!Not financial advice – just sharing my outlook. 📉📈
Price is currently rejecting the upper trendline resistance around $213 and struggling to hold above the $207-$208 zone.
Looking for potential puts as long as price remains under this key resistance area.
Will be buying the dip near the $195 or $185 zone where strong demand and trendline support intersect.
Key levels :
Resistance: $213.29 / $207.54
Support: $202.38 / $195.00
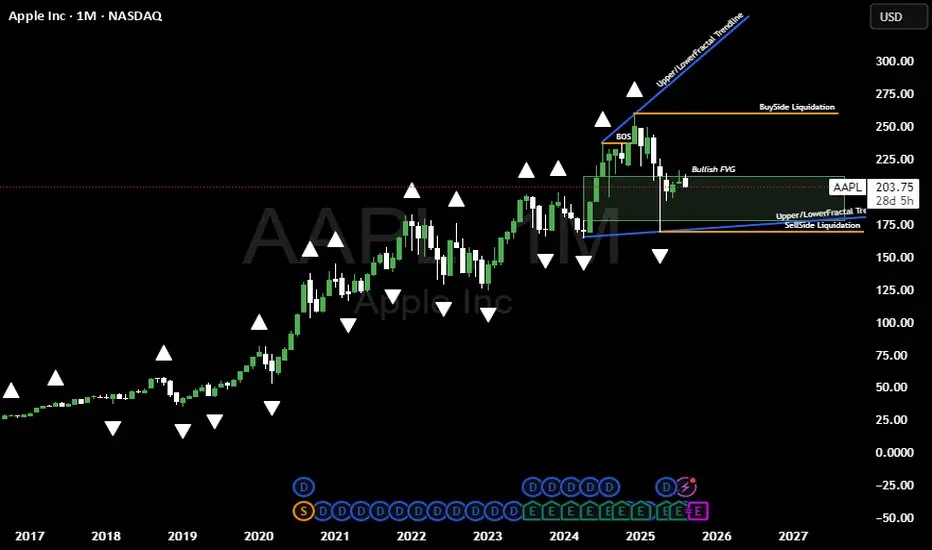
Bullish Idea on APPLNASDAQ:AAPL / Lovley day its been a while, am planing to share my views on the markets atleast once a week from now going forward. Basically on this bias idea above here @LutthMage we are leaning more on long term holding, WITH AN ADVANTAGE OF TAKING SHORT TERM TRADES BASED ON OUR LONG TERM INVESTMENT IDEA WE ARE SURE YOU WILL UNDERSTAND AS TIME GOES BY.
NOW LET THE GAMES BEGIN```
On the chart above we a basically bullish due to 4 reasons
1. The trend is our friend its currently bullish, because AAPL is BREAKING STRUCTURE NO VISIBLE Change of character as of yet
2. We got a widening channel currenly bouncing of the lower level line of the channel.
3. Price is playing around a Bullish FVG
4. APPLE JUST CREATED SELL SIDE LIQUIDITY.
We will keep you posted on the short term trades we execute based on this bullish bias on APPL, ofcourse only if they do appear for now we sit and do the hardest thing to do wich is NOTHING.
AS TIME GOES BY YOU WILL CHARACTERIZE A WASH RINSE AND REPEAT PROCESS FROM US @LutthMage NASDAQ:AAPL
AAPL: Symmetrical Triangle Breakdown with S-2 in FocusAAPL has now broken below a well-defined symmetrical triangle structure, as well as the ~$208 S-1 support area I’ve highlighted.
I’m watching the $194.91 zone (S-2), which served as a key support and pivot earlier this year. If price heads into that area, I’ll be looking for confirmation and stabilization before initiating a position.
If the setup aligns, I plan to trade it via Sep/Oct put sales around the $170/$175 strikes -- targeting levels I’d be comfortable owning if assigned, and collecting premium if not.
Not stepping in early here… just tracking structure, respecting price action, and planning around risk-defined entries. We’ll see how this one plays out. Stay tuned.

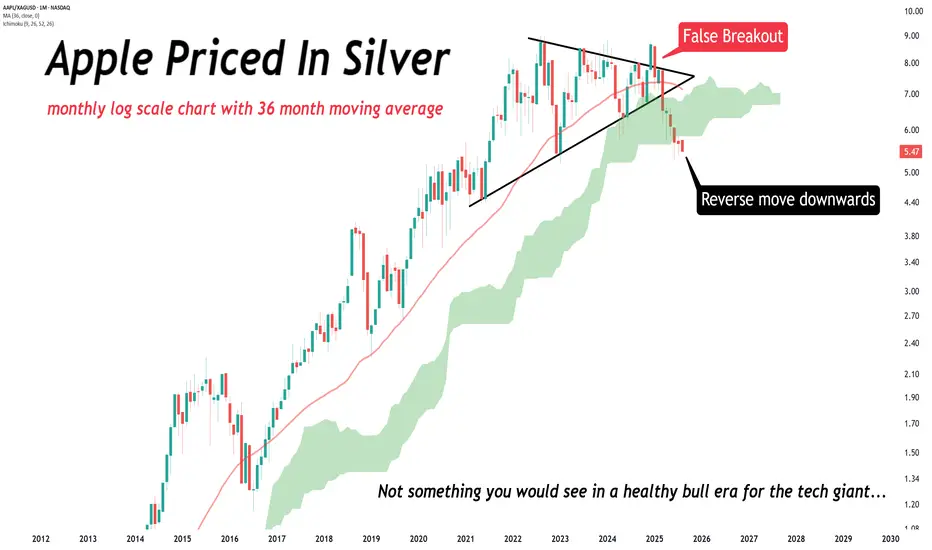
Since December, Apple LOST 37% of its value (priced in silver).Since December, Apple LOST 37% of its value (priced in silver).
You should NOT be seeing this happen in a bull era for the tech giant.
Weekly $AAPLNASDAQ:AAPL on the Weekly is still bearish. The price is trading below our EMAs that are even in a bearish order.
We need a stable move above $217 right now.
Not sure will come soon
AAPL/SPY ratio + AAPL Weekly Triangle TradeIn this video I cover the weekly Triangle pattern, with explaining my current trade and what moves I am prepared for. I also cover the AAPL/SPY ratio chart and why this may be useful when trading AAPL.

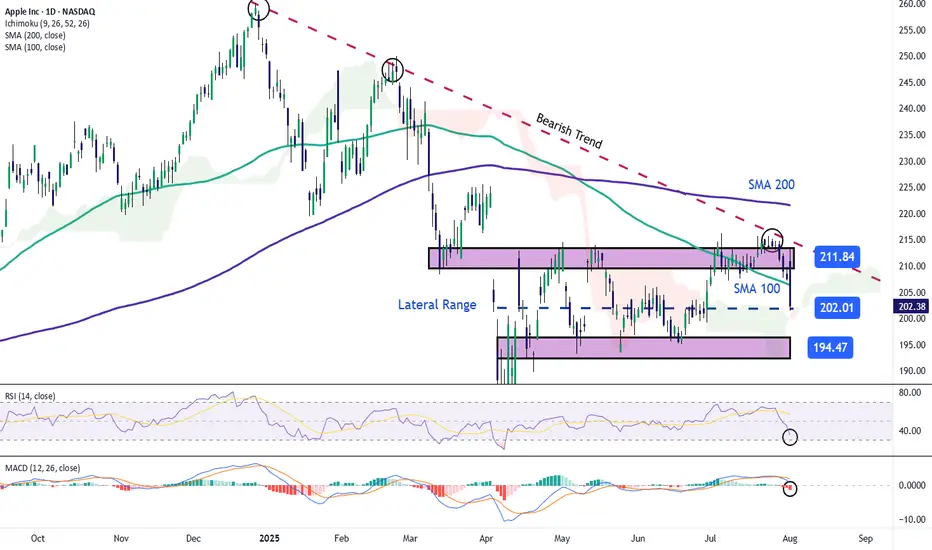
Apple Stock Falls Despite Strong EarningsApple stock is down more than 4% in the final session of the week, following the company’s earnings release yesterday. Apple reported earnings per share of $1.57, beating expectations of $1.43, while total revenue reached $94.04 billion, surpassing the $89.53 billion forecasted by the market.
However, despite the strong results, the stock is once again facing a notable short-term bearish bias as investor concerns grow. The primary issue is the perception that Apple is falling behind in the race for artificial intelligence, especially compared to its main competitors. In addition, shortly after the earnings announcement, it was noted that the company may face challenges in sustaining growth throughout the remainder of 2025, which has fueled additional downward pressure on the stock.
Sideways Range Emerges
In recent weeks, Apple’s price action has consolidated within a clear lateral range, with resistance around $211 and support near $194. So far, price fluctuations have not been strong enough to break this structure, and the latest bearish candlestick has reinforced the validity of the channel. For now, this sideways range remains the most relevant technical formation to watch in the upcoming sessions.
Technical Indicators
RSI:
The RSI line is falling rapidly and is now approaching the oversold zone at the 30 level. If the indicator reaches that threshold, it could suggest a technical imbalance, opening the door to a short-term bullish correction.
MACD:
The MACD histogram has moved into negative territory in recent sessions, suggesting a clear dominance of bearish momentum in the moving average structure. If this persists, selling pressure may continue to build in the near term.
Key Levels to Watch:
$211 – Main Resistance: Upper boundary of the current range. A breakout above this level could trigger a stronger bullish trend.
$200 – Psychological Support: Round number zone, a breakdown here could activate an immediate bearish bias for the next sessions.
$194 – Key Support: Corresponds to recent weekly lows. A move below this level would likely confirm a more extended bearish trend.
Written by Julian Pineda, CFA – Market Analyst
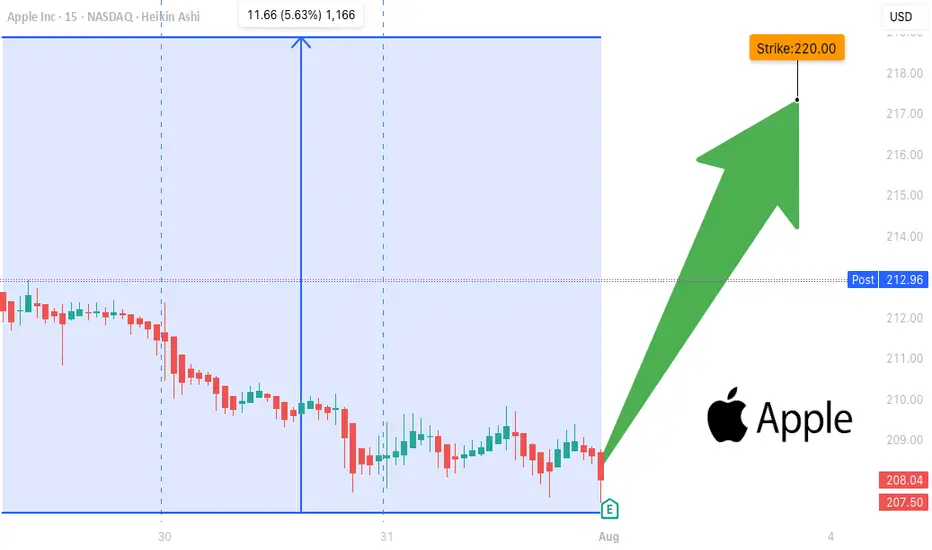
AAPL EARNINGS TRADE SIGNAL (JULY 31)
### 🍏 AAPL EARNINGS TRADE SIGNAL (JULY 31) 🚀
📊 **AAPL Call Play** — Earnings Strategy
🧠 Multi-model conviction: **75% Bullish Bias**
---
### 🔍 Fundamental Drivers
✅ TTM Revenue: +5.1%
✅ Gross Margin: 46.6%
✅ 8 straight earnings beats
⚠️ Sector shift: growth → value = caution
📉 TTM EPS Est: \$8.31 (+29.4% growth est.)
🧮 **Score**: 8/10
---
### 💰 Options Flow Breakdown
🔥 IV Rank: 0.70
🔵 Bullish OI @ \$220C = 25,950 contracts
🔻 Skew: Heavy puts @ \$197.5 / \$200
⚠️ Gamma squeeze possible near \$220
📈 **Score**: 8/10
---
### 📉 Technicals
📍 RSI: 39.3 (Oversold)
📉 Trading below 20DMA (\$211.64)
🟥 Low volume pre-earnings = low conviction
📌 Support: \$207.5 | Resistance: \$220
📉 **Score**: 6/10
---
### 🌐 Macro Setup
⚠️ Supply chain pressures
⚠️ Regulatory risk ongoing
🔄 Growth → Value rotation still underway
🌐 **Score**: 5/10
---
### 🧠 Trade Setup (Call Option)
* 🎯 **Strike**: \$220
* 💵 **Entry**: \$0.87
* 📅 **Expiry**: 08/01 (2DTE)
* 📈 **Target**: \$2.61
* 🛑 **Stop**: \$0.43
* ⚖️ **Risk**: 2% of portfolio
* ⏰ **Timing**: Enter before close, report after market
🧮 Expected Move: ±5.0%
🔒 Confidence Level: 75%
---
### ⚙️ Exit Plan
✅ Profit: Exit @ \$2.61
❌ Stop: Exit @ \$0.43
🕒 Time Exit: Force close within 2 hours post-earnings
---
📣 **EARNINGS SCALP PLAY**
— AAPL is oversold w/ strong EPS beat history
— Bullish OI stacking at \$220
— High gamma setup, low IV risk = 💥
\#AAPL #EarningsTrade #CallOption #TradingView #0DTE #OptionsFlow #GammaSqueeze #UnusualOptions #AppleEarnings #SwingTrade #TechStocks
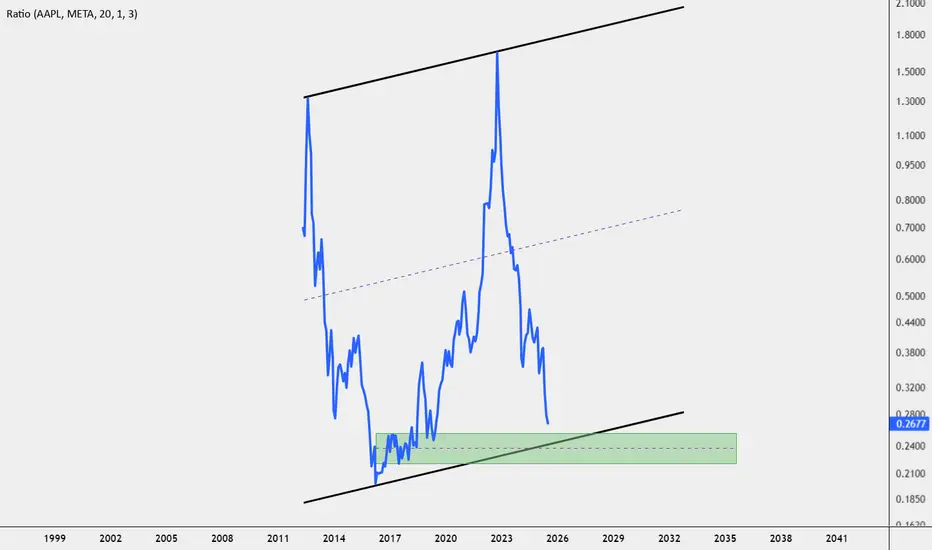
APPL/METAHi every one
You should gradually sell Apple and buy Meta.
From now on, I will call this type of analysis inter-market analysis.
Live data chart
A technical analysis summary (moving averages, RSI, MACD, etc.)
A fundamental snapshot of Apple (revenue, EPS, P/E)
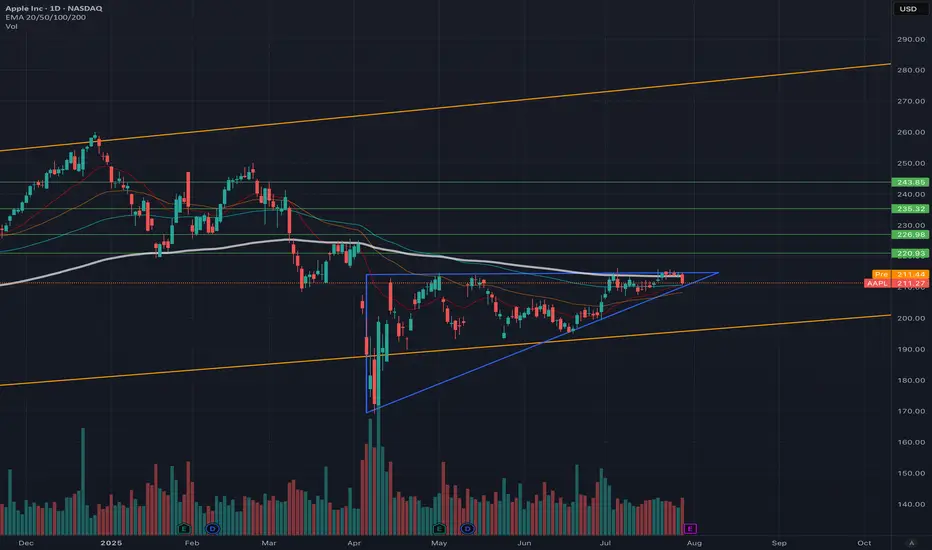
Ascending Triangle APPLE! Could be a big move up soon?!Very short technical idea. Apple could be forming a massive Ascending Triangle Pattern, which would be super bullish for this Magnificent 7 stock. It could also be looking to break soon!
It's a bullish continuation pattern, which usually indicates that an existing upward trend will persist once the pattern is completed.
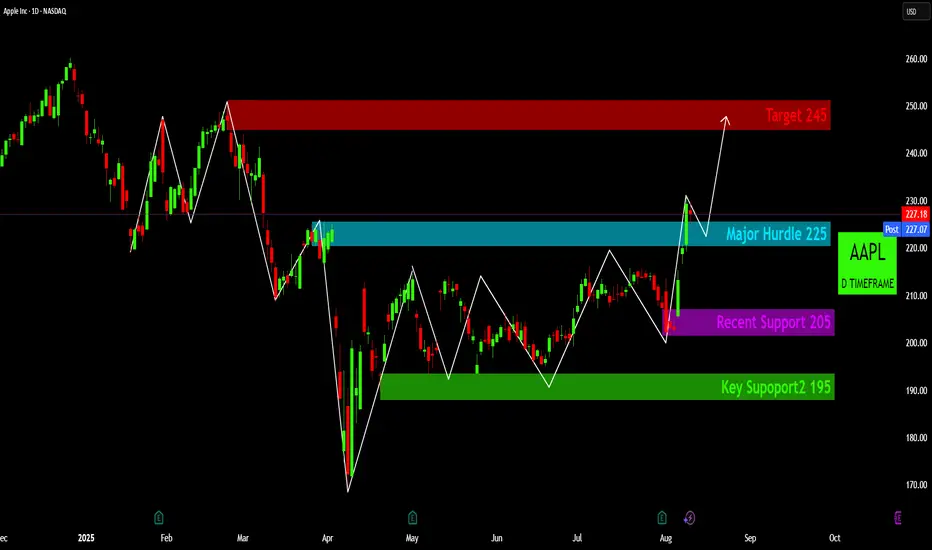
Apple's Ascent: Breaking Barriers, Targeting $245!AAPL: Preparing for Potential New Highs
Apple Inc. (AAPL) demonstrates a constructive bullish outlook on the daily timeframe, marked by a clear reversal pattern and a decisive breakout above a key resistance level. Recent price action indicates a notable shift in market sentiment, suggesting considerable upward potential.
Technical Foundation: Over recent months, AAPL has developed a solid bottoming formation originating from its April lows, anchored by consistent demand near $195 (Key Support) and further supported by a rebound from $205 (Recent Support). These levels highlight growing confidence among buyers, as well as effective accumulation at lower prices. 🛡️
Breakout Confirmation: A significant technical event occurred when price broke convincingly through the $225 (Major Hurdle) zone, which previously served as a substantial resistance area. This successful breakout provides confirmation of renewed bullish momentum and points to evolving market dynamics. 💥
Consolidation Phase: At present, AAPL is consolidating above the newly established support at $225. This consolidation is integral for digesting recent gains and validating the breakout level. Should $225 hold as support, it will reinforce the foundation for continued advancement. ✨
Upside Outlook: With the $225 barrier now surpassed and ongoing buying interest, the primary upside target is identified near the $245 level. This resistance aligns with prior highs and represents a logical short-term objective for price appreciation. 🎯
Risk Management Considerations: Despite the positive outlook, disciplined risk management requires close attention to key support areas. The $225 level (now support) is immediately relevant, followed by $205 and the critical $195 zone. Any breach of these supports should prompt a re-assessment of the prevailing bullish view. ✅
www.tradingview.com
www.tradingview.com
Disclaimer:
The information provided in this chart is for educational and informational purposes only and should not be considered as investment advice. Trading and investing involve substantial risk and are not suitable for every investor. You should carefully consider your financial situation and consult with a financial advisor before making any investment decisions. The creator of this chart does not guarantee any specific outcome or profit and is not responsible for any losses incurred as a result of using this information. Past performance is not indicative of future results. Use this information at your own risk. This chart has been created for my own improvement in Trading and Investment Analysis. Please do your own analysis before any investments.
AAPL: 229.35 4:27PM 8/11/25 for modayBullish Entry: 232.00 / 234.00 Bullish Stop: 230.00 Bullish Target: 234.00 / 236.00
Bearish Entry: 224.00 / 222.00 Bearish Stop: 226.00 Bearish Target: 222.00 / 220.00......pending the resistance zone 240.00/242/248.00

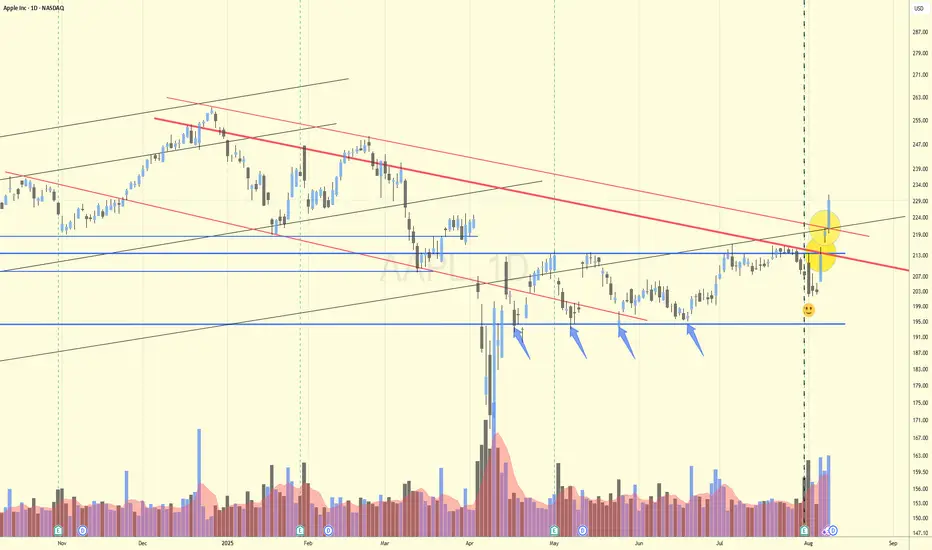
#AAPL 4 Touches on suppt then! Altve Trend line-day early break SOME INTERESTING CHART FEATURES
1. This often works...notice four price touches onto the the blue horizontal support line at $194 and then when it doesn't touch (see smiley) it often triggers a move, as in this case!
2. There's above average volume, verifying the move.
3. In recent years it's noticeable that multiple parallel trendlines coexist due to the trading computer algorithms. In this case there's a CLEAR parallel 'internal' trendline which was broken 1 day earlier than the higher trendline which was broken out off today.
To discover the 'internal' trendline resistances and supports, be prepared to draw through 'aberrations' of price movement. In this case there was a confluence between the downward-sloping black trendline, the closing price and the long-term rising black support.
4. The thick blue horizontal level at $214 produces a confluence in conjunction with the closing price line and the thick red downward-sloping resistance.
5. Another thing you often see, as with NASDAQ:AAPL is the price initially going DOWN after decent results (Puzzled me for nearly 30yrs!) and then shooting upwards.
PS: Yellow circles denote centres of confluence.
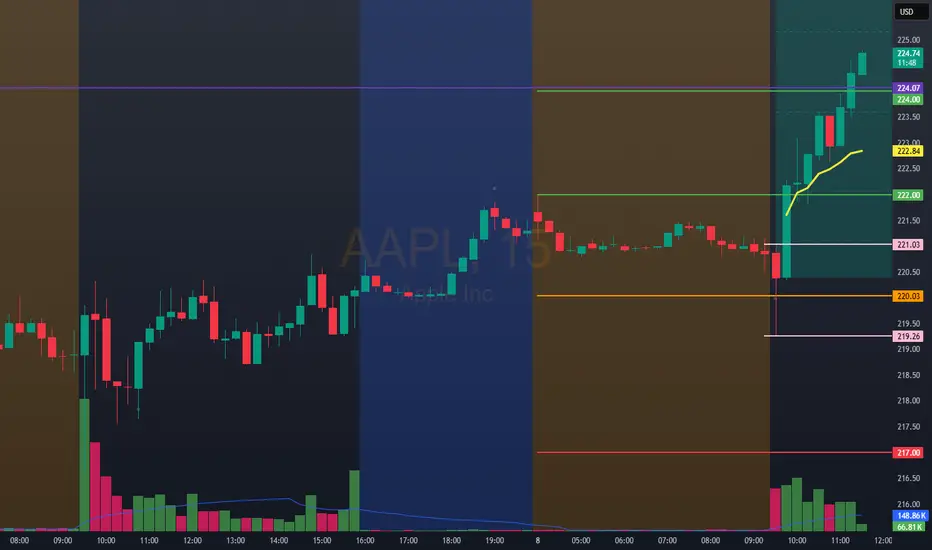
Trading AAPL 1:50 am 8/8/25Bullish Entry: 222.00 / 224.00 Bullish Stop 217.00 Bullish Target 226.00
Bearish Entry: 217.00 / 214.00 Bearish Stop 222.00 Bearish Target 208.00.....................Note that the 224.00 area is accompanied by a resistance
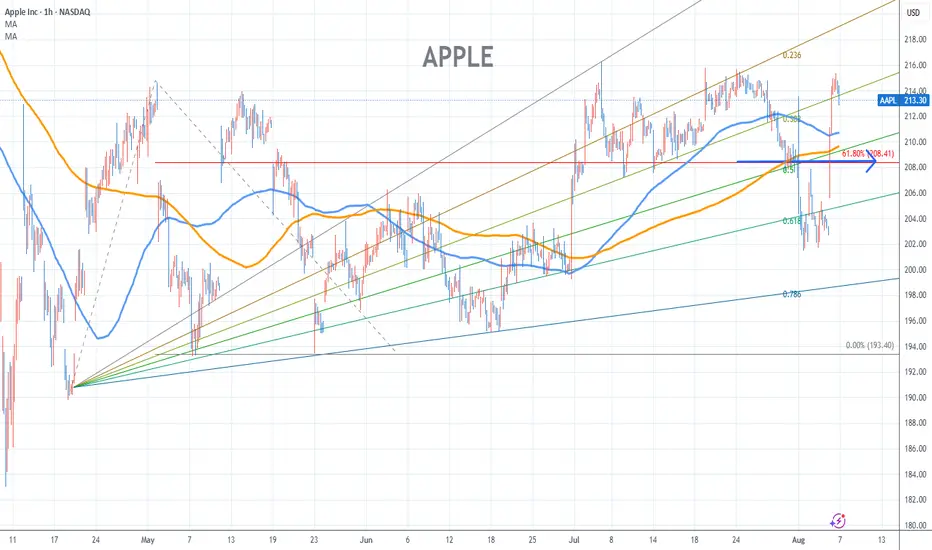
Apple Stock Chart Fibonacci Analysis 080625Trading Idea
1) Find a FIBO slingshot
2) Check FIBO 61.80% level
3) Entry Point > 208/61.80%
Chart time frame:B
A) 15 min(1W-3M)
B) 1 hr(3M-6M)
C) 4 hr(6M-1year)
D) 1 day(1-3years)
Stock progress:A
A) Keep rising over 61.80% resistance
B) 61.80% resistance
C) 61.80% support
D) Hit the bottom
E) Hit the top
Stocks rise as they rise from support and fall from resistance. Our goal is to find a low support point and enter. It can be referred to as buying at the pullback point. The pullback point can be found with a Fibonacci extension of 61.80%. This is a step to find entry level. 1) Find a triangle (Fibonacci Speed Fan Line) that connects the high (resistance) and low (support) points of the stock in progress, where it is continuously expressed as a Slingshot, 2) and create a Fibonacci extension level for the first rising wave from the start point of slingshot pattern.
When the current price goes over 61.80% level , that can be a good entry point, especially if the SMA 100 and 200 curves are gathered together at 61.80%, it is a very good entry point.
As a great help, tradingview provides these Fibonacci speed fan lines and extension levels with ease. So if you use the Fibonacci fan line, the extension level, and the SMA 100/200 curve well, you can find an entry point for the stock market. At least you have to enter at this low point to avoid trading failure, and if you are skilled at entering this low point, with fibonacci6180 technique, your reading skill to chart will be greatly improved.
If you want to do day trading, please set the time frame to 5 minutes or 15 minutes, and you will see many of the low point of rising stocks.
If want to prefer long term range trading, you can set the time frame to 1 hr or 1 day.
Apple Chart Fibonacci Analysis 080425Trading Idea
1) Find a FIBO slingshot
2) Check FIBO 61.80% level
3) Entry Point 203/61.80%
Chart time frame:B
A) 15 min(1W-3M)
B) 1 hr(3M-6M)
C) 4 hr(6M-1year)
D) 1 day(1-3years)
Stock progress:C
A) Keep rising over 61.80% resistance
B) 61.80% resistance
C) 61.80% support
D) Hit the bottom
E) Hit the top
Stocks rise as they rise from support and fall from resistance. Our goal is to find a low support point and enter. It can be referred to as buying at the pullback point. The pullback point can be found with a Fibonacci extension of 61.80%. This is a step to find entry level. 1) Find a triangle (Fibonacci Speed Fan Line) that connects the high (resistance) and low (support) points of the stock in progress, where it is continuously expressed as a Slingshot, 2) and create a Fibonacci extension level for the first rising wave from the start point of slingshot pattern.
When the current price goes over 61.80% level , that can be a good entry point, especially if the SMA 100 and 200 curves are gathered together at 61.80%, it is a very good entry point.
As a great help, tradingview provides these Fibonacci speed fan lines and extension levels with ease. So if you use the Fibonacci fan line, the extension level, and the SMA 100/200 curve well, you can find an entry point for the stock market. At least you have to enter at this low point to avoid trading failure, and if you are skilled at entering this low point, with fibonacci6180 technique, your reading skill to chart will be greatly improved.
If you want to do day trading, please set the time frame to 5 minutes or 15 minutes, and you will see many of the low point of rising stocks.
If want to prefer long term range trading, you can set the time frame to 1 hr or 1 day.
