NEW Update on APPL H4Detailed Analysis of the AAPL (Apple Inc.) Chart
This 4-hour chart of Apple Inc. (AAPL) from TradingView includes technical analysis elements such as supply & demand zones, price action patterns, and trend indicators to predict future price movements.
---
1. Trend Analysis
Supertrend Indicator (10,3)
The Supertrend is red, indicating a downtrend is currently in play.
A strong sell-off is evident, with the price dropping -5.59 (-2.40%) to $227.68.
Lower Highs & Lower Lows
The price is forming a descending pattern, meaning each rally is weaker than the previous one.
This signals that bears are in control and the stock may continue to decline.
---
2. Key Zones: Supply & Demand
Supply Zone (Resistance) - Near $250
This area is where selling pressure is historically strong.
Price attempted to rise but was rejected, reinforcing this zone as a resistance.
If the price were to break above, it could indicate bullish strength, but that is unlikely for now.
Demand Zone (Support) - Near $215-$225
This is where buyers previously stepped in and pushed the price higher.
If the price reaches this zone, we may see some buying activity.
However, if this zone fails, the price could fall further to lower levels.
---
3. Predicted Price Movement & Targets
The bearish scenario on the chart suggests:
1. AAPL may break below the demand zone (red support line).
2. If that happens, it could reach the first take profit (TP1) target at $220.
3. If the downward momentum continues, the second take profit (TP2) target is $210.
4. The final target (marked below TP2) could be around $190-$200, indicating a deeper decline.
Key Confirmation Signals to Watch
If AAPL breaks below $220, it could trigger a stronger bearish move.
If AAPL bounces at $220-$225, it could mean a short-term reversal.
A break above the supply zone ($250) would invalidate the bearish setup.
---
4. Trading Strategy Considerations
For Short Sellers (Bearish Traders)
✔️ Consider shorting AAPL if it breaks below $225 with volume.
✔️ Set stop-loss above $230 to minimize risk.
✔️ Take profits at $220 (TP1) and $210 (TP2) if the trend continues down.
For Buyers (Bullish Traders)
✔️ Wait for a strong bounce from the demand zone ($215-$225) before buying.
✔️ Watch for a reversal confirmation (e.g., bullish candlestick patterns).
✔️ If the price breaks above $250, a new uptrend may start.
---
5. Conclusion & Summary
📉 Bearish Outlook: The chart suggests a downtrend, with potential price drops to $220, $210, and possibly lower.
📊 Key Levels: $250 (Resistance), $225 (Support), and below $210 (Bearish Breakdown Zone).
⚠️ Risk Management: Watch for confirmation signals before entering a trade.
---
Final Thoughts
The overall market conditions and news events related to Apple (earnings reports, macroeconomic data, etc.) could influence this setup.
APC trade ideas

Guide For Channels Bluprint📢 Welcome, Fellow Traders!
In the ever-evolving world of financial markets, mastering the art of technical analysis is key to making informed and confident decisions. Whether you're a seasoned trader or just starting your journey, understanding the dynamics of ascending, descending, and parallel channels can give you an edge in identifying trends and market opportunities.
This article is crafted to help you navigate these fundamental patterns with clarity and precision. By the end of it, you'll not only recognize these channels but also learn how to leverage them in your trading strategies.
So, let’s dive in together and unravel the secrets of these channels on platforms like TradingView, where the world of analysis comes alive. Here’s to better insights and smarter trades!
Happy Trading! 🚀
⭐⭐ Trading channels are one of the most reliable tools in technical analysis. They help traders identify trends and make informed decisions. In this article, we will dive deep into ascending, descending, and parallel channels, exploring their characteristics, significance, and how to use them effectively.
1. What Are Trading Channels?
📊 A trading channel is a price range formed by two parallel lines: support (lower boundary) and resistance (upper boundary). These lines help identify the direction of the market trend:
Ascending Channel: Indicates an uptrend.
Descending Channel: Indicates a downtrend.
Parallel Channel: Suggests a sideways trend.
2. Ascending Channel
🔼 Definition:
An ascending channel, also called a rising channel, is characterized by higher highs and higher lows. It occurs when the price moves within a range that slopes upward.
🛠 Key Features:
Resistance Line: Connects higher highs.
Support Line: Connects higher lows.
Indicates a strong uptrend, signaling buying opportunities.
💡 How to Trade:
Buy Near Support: Enter trades when the price approaches the lower boundary.
Take Profit at Resistance: Exit trades near the upper boundary.
Breakout Strategy: Watch for a breakout above resistance for stronger bullish signals.
3. Descending Channel
🔽 Definition:
A descending channel, or falling channel, is formed when the price creates lower highs and lower lows. It indicates a downtrend.
🛠 Key Features:
Resistance Line: Connects lower highs.
Support Line: Connects lower lows.
Reflects bearish sentiment, signaling selling opportunities.
💡 How to Trade:
Sell Near Resistance: Short-sell trades when the price approaches the upper boundary.
Take Profit at Support: Exit trades near the lower boundary.
Breakdown Strategy: Monitor for a breakdown below support for stronger bearish momentum.
4. Parallel Channel
➖ Definition:
A parallel channel, also known as a horizontal or range-bound channel, is formed when the price moves sideways with consistent highs and lows.
🛠 Key Features:
Resistance Line: Stays flat, connecting equal highs.
Support Line: Stays flat, connecting equal lows.
Indicates market consolidation or indecision.
💡 How to Trade:
Buy at Support and Sell at Resistance: This is ideal for range-bound markets.
Breakout or Breakdown Strategy: Prepare for significant moves when the price exits the channel.
5. Tips for Identifying Channels on TradingView
🖊 Use Trendlines: Utilize TradingView’s trendline tool to connect support and resistance levels.
📈 Set Alerts: Configure alerts to notify you when the price approaches key levels.
🔍 Combine with Indicators: Use moving averages, RSI, or MACD for confirmation.
Conclusion-:
✅ Trading channels are powerful tools for understanding market behavior and making strategic decisions. Whether you’re analyzing an ascending channel for bullish trends, a descending channel for bearish trends, or a parallel channel for sideways markets, mastering these patterns can elevate your trading skills.
📢 Start practicing on TradingView and refine your approach to technical analysis. Success lies in identifying opportunities and managing risk wisely.

Apple Inc. (AAPL) Technical Analysis –Potential Bullish Reversalhello guys!
let's analysis Apple!
Support Area (~$219 - $221): This zone has previously acted as a strong demand level, preventing further decline.
Target Area (~$252 - $254): A key resistance level where the price might face selling pressure.
Candlestick Signal – Bullish Engulfing:
The engulfing pattern indicates a potential reversal, signaling bullish momentum after a decline.
If confirmed with increased volume, it strengthens the possibility of an upward move.
Trade Setup:
Entry: Around the current price level (~$227).
Stop-Loss: To minimize downside risk, below the support area (~$219).
Take-Profit Target: Around $252 - $254, aligning with the resistance zone.
Confirmation Factors:
A strong breakout above $230 would validate bullish momentum.
A retest of support with a bounce would reinforce the setup.
The bullish setup would be invalidated if the price falls below $219.
Conclusion:
Bullish Bias: The pattern suggests a recovery towards the target zone.
Key Level to Watch: $230 as confirmation for an upward move.
Risk Management: Stop-loss below support is crucial to limit losses.

AAPL chart play out?Can someone give me feedback on the potential play out leading into next week. Do you see the price rebounding to 232 and selling down to finish out the chart pattern?

BTC vs APPLThis Bitcoin Chart Could Predict the Next BIG Move!🚨
CRYPTOCAP:BTC (left) is mirroring #AAPL’s (right) 2015 cycle:
🔹 Broke previous ATH → Parabolic rally
🔹 Final leg up? ($120K/$125k target)
🔹 AAPL corrected hard after this move
🔹 BTC could follow → $50K-$60K retest 📉
🔹 #Altseason usually kicks off as BTC enters its “red zone” 🔥
History doesn’t repeat, but it rhymes. 👀
#Bitcoin #Crypto #Altseason #BTC


UPDATE Apple still looking up but with a warning signal Apple’s kept its share price solid by not putting all its eggs in one basket. They’ve gone beyond iPhones with big wins in services, wearables, and future tech, giving them a safety net that competitors often lack.
We did an analysis for upside on 10 June 2025, and now it looks like the prices are holding for now.
The crucial level is $231.37. If it breaks below it will be a potential Head and shoulders to play out. But will let you know.
In the meantime, the same pattern applies.
W Formation
Breakout confirmed
Target $301.56

Apple (AAPL) Recovers 50% from Recent DeepApple (AAPL) Recovers 50% from Recent Decline – Technical Outlook & Forecast
Apple Inc. (AAPL) has made a strong recovery after experiencing a sharp decline earlier this month. The downturn, which affected several major U.S. tech stocks, was largely triggered by the release of China’s AI model, DeepSeek, on the 21st. However, the broader market has since rebounded, regaining much of the lost ground.
Technical Analysis
AAPL is currently trading at a key technical level, the 50% Fibonacci retracement of its recent decline. This indicates a partial recovery from the previous drop, positioning the stock at a potential decision point for traders.
Support Level: $231
Resistance Level: $260
Current Price Area: Near 50% Fibonacci retracement
Trade Plan
Given the recent recovery, I anticipate a potential pullback before further upward movement. My strategy is as follows:
Entry: Waiting for a pullback to $237
Stop Loss (SL): $231 to limit downside risk
Take Profit 1 (TP1): $260, aligning with resistance levels
Conclusion
AAPL's recovery from its recent dip suggests strong buying interest. However, market volatility remains a factor, so careful risk management is essential. Trade with caution and follow your risk strategy.

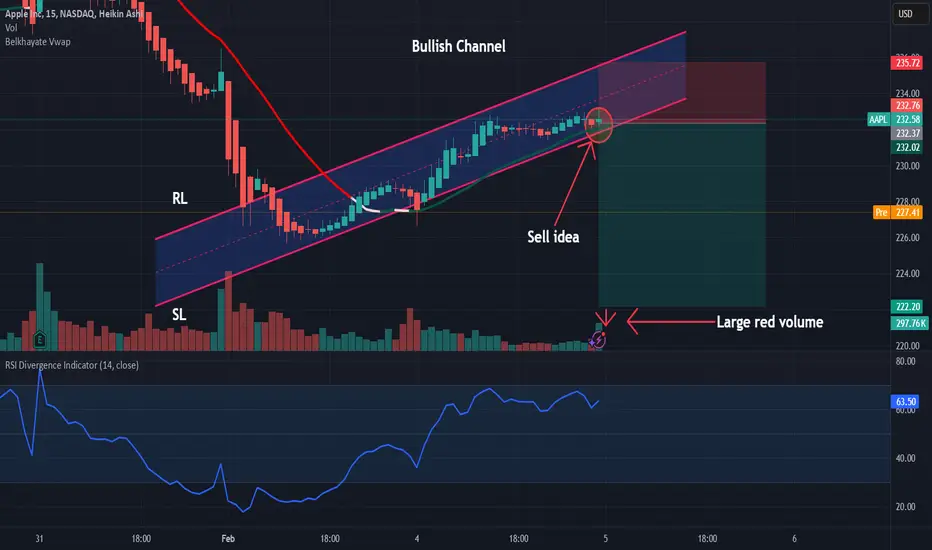
AAPL: Sell ideaOn AAPL, we are in a bullish channel situation. In such circumstances, we would have a high probability of seeing the market go down. This will be confirmed by the forceful break of the vwap and the support line.
AAPL Shares Drop Amid Trump’s Tariffs Despite Strong EarningsAAPL Shares Drop Amid Trump’s Tariffs Despite Strong Earnings
Last week, Apple (AAPL) reported quarterly earnings that exceeded analyst expectations:
→ Earnings per share: $2.40 (expected: $2.35)
→ Revenue: $124.3 billion (expected: $124.2 billion)
Zacks analysts called the results “favourable,” yet Apple’s stock movement tells a different story:
→ On 31 January, shares opened with a bullish gap around $247, briefly improving AAPL’s weak start to the year.
→ By 3 February, the stock closed near $227, marking a 7.4% decline over just two sessions.
The downward pressure on AAPL may be due to:
→ Shifting sentiment around U.S. tech leadership in AI, following the success of Chinese startup DeepSeek’s free chatbot.
→ Trump’s tariffs, particularly the new 10% levy on Chinese imports, which could impact Apple’s future performance.
According to BofA Securities analysts:
→ The impact on profits should be “limited,” as around 80% of Apple devices can be manufactured outside China.
→ AAPL remains attractive, with a “buy” rating and a $265 price target, supported by stable cash flow, strong earnings, and AI-driven opportunities.
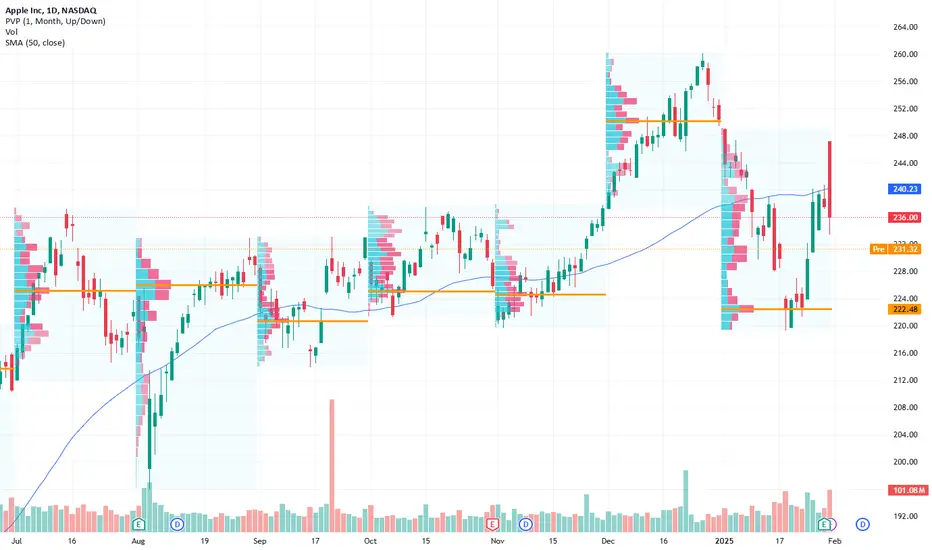
Technical analysis of Apple (AAPL) stock shows that the price has been forming a long-term upward channel (marked in blue) since summer 2024, with the following key observations:
→ Bearish perspective: The price has sharply dropped from the upper half of the blue channel (as shown by the arrow), testing a potential bearish breakout of the previous uptrend (marked in black) from late 2024.
→ Bullish perspective: The lower boundary of the channel, around $222, may serve as a key support level, potentially preventing further declines.
Trade on TradingView with FXOpen. Consider opening an account and access over 700 markets with tight spreads from 0.0 pips and low commissions from $1.50 per lot.
This article represents the opinion of the Companies operating under the FXOpen brand only. It is not to be construed as an offer, solicitation, or recommendation with respect to products and services provided by the Companies operating under the FXOpen brand, nor is it to be considered financial advice.

Head & Shoulders reversal pattern: AAPL chartBeautiful symmetric reversal Head & Shoulders pattern is in the making.
We have three peaks with the highest in between called Head.
Left and right peaks are "shoulders".
The line between valleys of the Head is called Neckline.
This pattern reverses the price course at the climax.
Trading technique:
Sell entry is triggered on the breakdown of the Neckline
Stop loss is at the invalidation point - breakup of the Right Shoulder (red dashed line)
Take profit is set at the height of the Head subtracted below Neckline (blue dashed line)

AAPL GEX Analysis and Option Trading SuggestionsKey Observations from GEX Chart
1. Call Resistance:
* Significant call resistance at $250, with additional resistance at $240. These levels act as major upside barriers for AAPL unless there is a strong bullish catalyst.
2. Put Support:
* The highest negative gamma concentration is seen at $220, providing solid support. Breaking below this level could signal further bearish momentum.
3. Gamma Pivot Zone:
* $230 appears to be the gamma pivot point, where the balance between calls and puts shifts. Sustaining above this level indicates bullish sentiment, while dropping below could lead to bearish pressure.
4. IVR (Implied Volatility Rank):
* IVR at 42.8 shows moderate implied volatility, suggesting balanced opportunities for both buyers and sellers of options.
5. Implied Volatility (IVx):
* IVx at 29.9, coupled with a decrease of -3.78%, indicates relatively stable volatility, favoring directional trades with lower premiums.
Option Trading Suggestions
1. Bullish Scenario:
* If AAPL holds above $230:
* Trade Idea: Buy a Call Debit Spread.
* Strike 1: $230 (Buy Call)
* Strike 2: $240 (Sell Call)
* Expiry: 1-2 weeks out.
* Reasoning: Targets the resistance at $240 while limiting costs.
2. Bearish Scenario:
* If AAPL breaks below $230:
* Trade Idea: Buy a Put Debit Spread.
* Strike 1: $230 (Buy Put)
* Strike 2: $220 (Sell Put)
* Expiry: 1-2 weeks out.
* Reasoning: Aims to capitalize on downside momentum toward $220 support.
3. Neutral Strategy:
* For consolidation between $220 and $240:
* Trade Idea: Sell an Iron Condor.
* Sell Put: $220
* Buy Put: $215
* Sell Call: $240
* Buy Call: $245
* Reasoning: Captures premium within a well-defined range while capping risk.
Thoughts and Insights
* Momentum Check: Holding $230 is key for any bullish continuation. Breaking below $220 may lead to bearish acceleration.
* Volatility Context: The moderate IVR supports flexible strategies, while the IVx drop suggests reduced risk of unexpected price swings.
* Key Levels to Monitor:
* Support: $230, $220
* Resistance: $240, $250
Reminder:
GEX data updates every 15 minutes. Always check real-time data for adjustments before executing trades.
Disclaimer:
This analysis is for educational purposes only and does not constitute financial advice. Always conduct your own research and risk management before trading.

[02/03] AAPL GEX Outlook for February expirationWhile iPhone sales faced some challenges, Apple’s diversified revenue streams and high-margin services business continue to showcase the company’s resilience. The stock initially reacted positively after earnings, but the broader market disagreed during open hours, leading to a sell-off on Friday.
Now, let’s analyze the GEX chart together. For NASDAQ:AAPL , I’ve chosen the First Monthly Expiration (Febr 21), as multiple high gamma exposure expirations align with this date. Since we trade stocks and ETFs over a broader timeframe, rather than day trading, this is the most relevant perspective.
Key GEX Levels & Market Implications
📌 Uncertainty Below 250
Friday’s sell-off and today’s premarket action have weakened the outlook.
GAMMA FLIP ZONE:
AAPL is currently in the 230-237.5 Transition Zone, meaning price action can shift quickly in either direction.
📌 Break Below 230?
A move below 230 would open the door to 220.
📌 Put Support at 220
Implied volatility (IV) remains high, making this an attractive setup for a potential neutral post-earnings trade.
With a 220-250 range, we remain well inside the OTM 16-delta zone for March expiration, which is ideal for premium selling strategies for high IV.
PS: FINAL GEX ZONE COLORING SHEET

AAPL: Cautious Optimism Amid Turbulent Market Conditions
- Key Insights: Apple Inc. continues to display short-term bullish tendencies as
it trades above its 20-day moving average. However, concerns around tariff
implications and mixed earnings, especially regarding iPhone sales in China,
warrant a cautious stance. Current market sentiment reflects both optimism
from short-term technical indicators and apprehension about long-term
growth.
- Price Targets: Next week targets are as follows: T1: 240.00, T2: 243.00. Stop
levels are set at: S1: 232.00, S2: 230.57. The configuration implies a long
position, adhering to the price level rules outlined where $230.57 < $232.00
< 236.00 < 240.00 < 243.00.
- Recent Performance: Recently, Apple's stock price fluctuated near resistance
at $236.00. Despite seeing a slight boost after earnings, it closed lower
due to worries over underwhelming iPhone sales in a key market, China. This
reflects a nuanced market sentiment with potential volatility ahead.
- Expert Analysis: Analysts maintain a cautiously optimistic view on Apple,
considering it alongside major players like Nvidia and Tesla in the AI
space. However, there remains skepticism about the company's future earnings
due to rising tariffs and infrastructure costs that could hinder its growth
potential.
- News Impact: Noteworthy developments include Apple's decision to resume
advertising on X, which indicates an adaptive strategy in its outreach.
However, the mixed results from its latest earnings report and ongoing
tariff issues, particularly with China, introduce significant risks that
could impact stock performance in the coming weeks.
AAPL: Key Breakdown or Recovery? Jan. 3 Technical Analysis (TA) Overview for AAPL:
* Price Action: AAPL faced a sharp sell-off from the $247 region, breaking below intermediate support at $240. Currently, the price hovers near $233. The volume spike during the breakdown signals strong bearish sentiment.
* Trend Lines: A narrowing wedge is forming with lower highs and support near $230, marking this level as critical for the next directional move.
* Indicators:
* MACD: Shows bearish momentum with a widening histogram, signaling possible continuation to the downside.
* Stochastic RSI: Deeply oversold, suggesting a potential short-term bounce but lacking confirmation.
Key Support and Resistance Levels:
* Support:
* Major: $230 (breakdown point).
* Secondary: $218 (Put Wall with -69.34% NETGEX support).
* Resistance:
* Immediate: $240.
* Secondary: $247 (previous swing high).
Options GEX Analysis for AAPL:
* Call Wall Resistance:
* $250 (Major resistance level with 42.24% GEX).
* $248 (Gamma Wall).
* Put Support:
* $225 and $218 (-69.34% NETGEX shows strong put flow here).
* Volatility Metrics:
* IVR: 34.7 (moderate implied volatility).
* Options Flow: Bearish leaning with PUT$ dominance at 69%.
Trade Scenarios:
1. Bullish Scenario:
* AAPL must reclaim $240 to regain bullish momentum. If it clears $240 with volume, target $247-$250.
* Entry: $240 breakout.
* Target: $247, $250.
* Stop-Loss: $235.
2. Bearish Scenario:
* If AAPL fails to hold $230, expect accelerated selling toward $225 or even $218.
* Entry: Below $230.
* Target: $225, $218.
* Stop-Loss: $234.
Conclusion:
Monitor $230 closely as it defines the next directional bias. Options flow and GEX suggest strong put pressure below $230 but with room for a technical bounce. Stay cautious and adjust trades based on momentum at key levels.
Disclaimer:
This analysis is for educational purposes only and does not constitute financial advice. Always conduct your own research and trade responsibly.

AAPL SELL ANALYSIS SMART MONEY CONCEPT Here on Aapl price from a supply around level of 239.40 and is likely to continue moving down so trader should go for short with expect profit target of 221.87 . Use money management

AAPL's forming head-and-shoulders
The AAPL chart image that I drew up is a prime example of where I am exiting my short position and entering a call option.
MACROECONOMICS
AAPL is forming a head-and-shoulders charting pattern, signaling a bearish trend that could be followed by a potential bullish rebound. On Friday afternoon, Mr. DJT announced a 10% tariff on China, in addition to the existing 20% on Canada and Mexico due to the fentanyl issue in America coming from these fucks.
Furthermore, DJT plans to tax foreign entities purchasing GPU chips from American manufacturers. Singapore, which accounts for 15% of NVDA's chip exports, recently reported an increase to 22%, selling an estimated 50k H100 GPU chips (priced at $30k each) to DEEPSEEK. This led to the TECH crash on Monday, causing NVDA to lose approximately $580 billion in market share.
JOBS data reports are set to be released on Tuesday, the 4th, and the numbers are unlikely to be as favorable as last month's. Many large companies worldwide, including BlackRock and Charles Schwab, are laying off thousands of employees. The consumer price index report, released on February 12th, is expected to show an increase from the previous two stable reports. Overall, I anticipate a bumpy February and plan to capitalize on the bearish AAPL trend. If you are purchasing stocks or crypto on your own, and plan to hold long term, set buy limits where equal lows have previously formed. The AAPL chart image that I drew up is a prime example of where I am exiting my short position and entering a call option.

APPL weekly pullback into structureLooks to have completed a 3 wave move to the upside, as confirmed by RSI divergence. Expecting a pullback with the market into structure to retest the breakout.

AAPL 1.22.2025 IdeaMy assessment is a fair price on the stock of $230 per share. AAPL now sitting at $222.5, I believe there is a high probability for a 5% up move within a few months.
Entry would be favorable if AAPL =< $220. I would enter direct shares here.
AAPL is of those companies that will be affected by tariffs. However, AAPL has benefitted from expanding its services economy. In other words, AAPL is not reliant on iPhone sales to drive their FCF. This opportunity is one for those looking for a discount on a MAG 7. Just be patient! But be flexible and anticipate further disruptions.

AAPL's Today SessionCurrent Market Overview
* Price: Trading around $237.21 with a downward move today.
* Volume: Noticeable volume spike during the recent sell-off, indicating active participation.
* Trend: Breaking below key EMAs and weakening momentum suggests bearish sentiment in the short term.
Key Observations
1. Support and Resistance Levels:
* Immediate Resistance: $243.69 (Recent consolidation top).
* Major Resistance: $248.35 (Gamma resistance and prior rejection level).
* Immediate Support: $230 (Critical Gamma level).
* Major Support: $218.20 (Gamma Put Support, recent low).
2. Indicators:
* MACD: Negative crossover, with histogram showing increasing bearish momentum.
* Stochastic RSI: Extremely oversold (below 10), indicating potential for relief bounce.
* Volume Trend: Higher volume in sell candles reflects strong selling pressure.
3. Price Action:
* Bearish momentum has broken, signaling continued downside risk.
* Current rejection at $240 aligns with increased selling activity.
4. Gamma Analysis:
* Highest Call Wall: $250 (resistance zone).
* Highest Put Wall: $230 (critical support zone).
* Market positioning below $240 suggests a shift to bearish Gamma.
Trade Setups
Bullish Scenario:
* Entry: Above $240 on a retest with a strong bullish candle and volume confirmation.
* Target: $243.69 → $248.35.
* Stop-Loss: Below $238.
Bearish Scenario:
* Entry: Below $236 with increased bearish volume.
* Target: $230 → $218.20.
* Stop-Loss: Above $238.
Neutral Play:
* Monitor price action near $230 for a potential bounce or breakdown.
Conclusion
AAPL is showing short-term bearish momentum, but oversold indicators suggest a relief bounce is possible. Watch $230 for support and $240 for resistance as key pivot levels. Traders should use caution in these volatile conditions and keep a close eye on Gamma levels for directional clarity.
Disclaimer: This analysis is for educational purposes only. Always perform your own due diligence and manage risk accordingly.

Apple Surges 3% in Premarket Amid AI Optimism & Strong ForecastApple Inc. (NASDAQ: NASDAQ:AAPL ) has seen a notable 3.46% surge in premarket trading, defying concerns over declining China sales. The upward momentum follows an optimistic sales forecast, hinting at a resurgence in iPhone demand fueled by Apple's strategic adoption of artificial intelligence (AI) features.
Earnings Outlook
Apple’s latest earnings report revealed a nuanced performance, with robust overall revenue counterbalanced by a slight dip in iPhone sales. Despite a shortfall in China, where revenue declined 11% to $18.5 billion—falling short of the projected $21.57 billion—Apple’s services unit exhibited strong growth, climbing 14% year-over-year to $26.34 billion. This exceeded Wall Street expectations of $26.09 billion, reinforcing Apple’s ability to diversify revenue streams beyond hardware sales.
CEO Tim Cook emphasized that Apple Intelligence, the company’s AI-powered suite of features, is playing a crucial role in boosting iPhone sales where available. However, Apple’s cautious approach to AI investments, unlike its peers such as Microsoft (MSFT) and Meta (META), has insulated its stock from recent market turbulence. The restrained AI strategy aligns with Apple's focus on integrating AI within its hardware ecosystem, enhancing device functionality without excessive capital expenditure on data centers.
The company posted earnings of $2.42 per share on revenue of $124.3 billion, surpassing analyst expectations of $2.36 EPS on $124.12 billion revenue. While iPhone sales, accounting for nearly half of Apple's revenue, declined to $69.14 billion from $69.70 billion year-over-year, the broader growth trajectory suggests a potential iPhone rebound in FY26.
Technical Outlook
From a technical standpoint, NASDAQ:AAPL is demonstrating strong bullish patterns. The stock is currently up 3.41%, benefiting from the renewed confidence in its growth trajectory. Prior to this recent rally, Apple shares had experienced a 15% decline since late December 2024. However, the current price action suggests a recovery, with NASDAQ:AAPL reclaiming 10% of its lost value, forming a falling wedge pattern—a historically bullish signal.
The premarket surge sets up the possibility of a gap-up pattern at market open, a strong bullish indicator that could further accelerate buying pressure. In the event of a pullback, immediate support lies at the 61.8% Fibonacci retracement level, a key level that often dictates price reversals in technical analysis.
The China Factor and AI’s Role in Future Growth
While Apple’s sales slump in China remains a wildcard, analysts expect a recovery once Apple Intelligence is introduced in the region. The lack of AI features has been cited as a major reason for weaker-than-expected sales in the Chinese market. TD Cowen analysts predict that demand could rebound once Apple secures a local partner to facilitate AI integration, boosting sales in a highly competitive market.
Moreover, Apple's performance relative to its tech peers remains strong. In 2024, Apple stock surged 30.07%, outperforming Microsoft’s 12.09% increase but trailing Meta’s impressive 65.42% rise. Apple’s 12-month forward price-to-earnings (P/E) ratio stands at 31.12, compared to Microsoft’s 29.2 and Meta’s 26, indicating sustained investor confidence in Apple’s long-term growth potential.
AAPL Positioned for Further Gains
Apple’s ability to weather market challenges, coupled with its strategic AI rollout, positions it favorably for continued growth. The bullish technical setup, strong fundamentals, and AI-driven sales optimism indicate that AAPL could maintain its upward trajectory. Investors should monitor key support and resistance levels, as well as further developments regarding Apple Intelligence’s expansion into new markets.
With analysts raising price targets and market sentiment improving, Apple’s stock could be on track for a sustained rally in 2024 and beyond.

AAPL Earnings Bearish ContinuationFor the past few trading sessions AAPL has been rejected at 240 with big volume. It is currently consolidating under the .50 fib ratio and a close below 240 signals more downsides for earnings. This is not financial advice but my opinion based on technical analysis.

Apple Silicon: Running Massive AI models### Why is DeepSeek a Game Changer for Apple
** credits to alexocheema on twitter
Apple might not be the first name you think of when it comes to AI hardware, but their silicon is surprisingly well-suited for running massive models like DeepSeek V3 and R1—at a fraction of the cost of traditional GPUs.
#### **How Apple’s M2 Ultra Stacks Up Against the Competition**
Here’s a look at some of the top AI chips on the market and how they compare in memory capacity, bandwidth, and price per GB:
- **NVIDIA H100**: 80GB @ 3TB/s → **$25,000** ($312.50 per GB)
- **AMD MI300X**: 192GB @ 5.3TB/s → **$20,000** ($104.17 per GB)
- **Apple M2 Ultra**: 192GB @ 800GB/s → **$5,000** ($26.04 (!!) per GB)
Apple’s M2 Ultra, launched in mid-2023, is *4x cheaper* per GB than AMD's MI300X and a *staggering 12x cheaper* than NVIDIA's H100. That’s a huge advantage, especially for models that require large amounts of memory.
#### **Why Does This Matter for DeepSeek?**
DeepSeek V3 and R1 are *Mixture of Experts (MoE)* models with a total of **671 billion parameters**—but here’s the trick: only **37 billion** of those parameters are active at any given time when generating a token. The challenge? We don’t know which 37B will be needed in advance, so they must all be ready in **high-speed GPU memory**.
This means system RAM is too slow (resulting in less than 1 token per second), while GPU memory is expensive. Apple Silicon, however, plays a different game. Instead of going all-in on raw speed, it offers a sweet spot—a large pool of medium-fast unified memory at a much lower cost.
#### **What Makes Apple Silicon Special?**
Apple has two key technologies that make this possible:
- **Unified Memory** – Apple Silicon uses a single shared memory pool instead of keeping separate memory pools for the CPU and GPU (like NVIDIA and AMD do). This eliminates the need for expensive and slow data transfers between CPU and GPU.
- **UltraFusion** – Apple’s proprietary interconnect technology that links two chip dies together at **2.5TB/s** of bandwidth. The M2 Ultra is literally two M2 Max chips fused into one, giving it **192GB** of unified memory with **800GB/s** bandwidth.
Now, if the rumors about the **M4 Ultra** are true, Apple will take this even further by fusing two **M4 Max** chips, resulting in:
✅ **256GB of unified memory**
✅ **1146GB/s bandwidth**
✅ **57 tokens per second** for DeepSeek V3/R1 (4-bit) with **two M4 Ultras**
This means Apple users could have **serious AI compute power** at a fraction of the cost of traditional GPU setups.
#### **More Than Just Hardware**
Apple is not just delivering great hardware—it’s also making **big strides in AI software** (which is rare for them).
- **MLX** has made it easy to run machine learning workloads on Apple Silicon.
- **ExoLabs** has successfully **clustered multiple Apple devices** to run large AI models, including DeepSeek R1 (671B) on **7 Mac Minis**.
While it's still unclear which company will dominate AI model development, **one thing seems certain: AI will likely run on American hardware & Apple Silicon**
