It's time to bite the appleI see the minimum drop at 180, but nothing prevents it from going down to 160, at least from there I would start to buy again.
APC trade ideas

Thing could get ugly for apple Ill argue my last breath on apple but pattern seems to tell a better story and would expect a strong dip before earnings followed by a bigger dip on earnings... apple under 200 again?

Elliott Wave Analysis on Apple (AAPL) 5 Waves Rally Favors BulliShort Term Elliott Wave in Apple (AAPL) suggests pullback to 195.99 ended wave IV. The stock has turned higher in wave V with internal subdivision as 5 waves impulse. However, it still needs to break above previous wave III peak at 237.23 on July 15 to rule out a double correction. Up from wave IV, wave (1) ended at 213.5 and wave (2) pullback ended at 201.07. The stock nested higher with wave 1 ended at 214.25 and pullback in wave 2 ended at 210.64. Stock then resumed higher in wave 3 towards 227.98 and wave 4 ended at 224.80. Final wave 5 higher ended at 228.34 which completed wave (3).
The stock then pullback in wave (4) with internal subdivision as a double three Elliott Wave structure. Down from wave (3), wave W ended at 223.9 and wave X ended at 228.22. Wave Y lower ended at 223.3 which completed wave (4) in higher degree. The stock has turned higher in wave (5). Up from wave (4), wave 1 ended at 229.86 and wave 2 pullback ended at 225.53. Wave 3 higher ended at 232.92 and wave 4 pullback ended at 229.30. Expect the stock to end wave 5 and this should complete wave (5) of ((1)) in higher degree. Afterwards, the stock should pullback in wave ((2)) to correct cycle from 8.5.2024 low in larger degree 3, 7, or 11 swing before it resumes higher. Near term, as far as pivot at 195.99 low stays intact, expect dips to find buyers in 3, 7, 11 swing for further upside.

Optimizing Buy Strategies for Apple Inc. (AAPL) StockOptimizing Buy Strategies for Apple Inc. (AAPL) Stock
Description:
Unlock the potential of trading Apple Inc. (AAPL) with this comprehensive guide, focusing on key fundamental factors that can drive the stock's performance. This approach equips you with the necessary insights to make well-informed buy decisions in one of the world’s most influential companies.
Fundamentals Overview:
1. **Revenue and Earnings Growth**: Keep track of Apple’s quarterly earnings reports and revenue growth. Strong sales of key products like iPhones, MacBooks, and services can signal a healthy performance and positively impact the stock price.
2. **Product Launches and Innovations**: Apple’s product pipeline is crucial to its market position. Upcoming launches, innovations in technology, and expansion into new markets or services can be significant catalysts for stock price appreciation.
3. **Market Share and Competitor Analysis**: Analyze Apple’s market share within the tech industry, especially in smartphones, wearables, and services. Understand how Apple positions itself against competitors and how shifts in market dynamics could influence its stock performance.
4. **Macroeconomic Factors**: Consider the broader economic environment, including consumer spending trends, supply chain challenges, and currency fluctuations. These factors can affect Apple's revenue and profitability, thus impacting stock valuation.
Disclaimer:
Investing in individual stocks, including Apple Inc. (AAPL), carries risks and may not be suitable for all investors. Stock prices can be volatile and are influenced by a wide range of factors, including market conditions, company performance, and macroeconomic variables. It is important to conduct thorough research, consider your financial situation and risk tolerance, and consult with a financial advisor before making any investment decisions. Past performance is not indicative of future reference
AAPL: Buy ideaBuy idea on AAPL as you can see on the chart if we have the breakout with force the resistance line by a big green candle follow by a large green volume.
Apple is a great buy once it exceeds 240!
The stock experienced an extended period of consolidation, during which it formed several bullish chart patterns, including the Double Bottom and Rounding Bottom.
After the price broke above the neckline of the Rounding Bottom, the stock surged to reach an all-time high close to the 237 level.
Since then, it has retraced nearly 17%-18%, returned to its support level.
Now, with a robust rebound underway, the stock is approaching its resistance zone, and there are strong expectations for a significant breakout.
The optimal buying opportunity lies just above the 240 level.

Start of wave CI am not an expert and would like an expert opinion on my analysis.
I see a start of wave C formation and we should go down to 187-193 region.

AAPL BUY $223 first targetAAPL filled the gap after ER, is holding over $213 and forming a wedge we should take out $223 in coming days

Apple price fall because of S&P 500 correction to 3900 range.Trade at your own risk.
Apple since 2003 price at USD0.32 has breakout to USD197 at the recent peak. The stock is currently having a correction since S&P 500 is also having a correction from peak 4605 to around 3900 to 3850. 15% correction.
Apple current price USD166.89 will drop to the 4 hours support level at USD161.41. If there is a breakout, then the price will head to USD142.23 at 1 day support level. The price will not drop to USD112.77 the 1-week support level as we are near the November 2023 FOMC Feds meeting. Most likely there will be good news and an emergence of a strong tailwind for the market after the meeting.
Impossible for the share price to drop to USD 24.41 on the 1-month support level.
Recommend a buy at USD142.23 level on technical Analysis perspective.
USD166.89 will be this week or next week bottom price. Might or might not breakout depending on the outcome of the FOMC Feds meeting.

Apple (AAPL): Swing Entry on the HorizonLast time, we narrowly missed the entry on Apple by just a few dollars, and after that miss, the stock no longer presented a compelling opportunity, so we decided to wait. However, after observing from the sidelines for a few months, it seems that another chance to secure a profitable swing entry might be approaching.
To increase our confidence in this potential opportunity and secure a better entry point, we need to closely monitor further movements from this tech giant. The current price action strongly suggests that a flat pattern might be forming following the recent drop. If this flat pattern does materialize, it could manifest as either a regular flat or an expanded flat, and this will be crucial in determining our entry target zone. At this stage, the area between $200 and $180 seems the most probable and attractive for a potential entry.
Given the broader market trends and Apple’s recent performance, this zone could offer a favorable risk-reward ratio. We’ll be watching for any developments that confirm this pattern and provide a clearer signal for entry. Stay tuned for further updates as we refine our strategy and prepare for a possible move on Apple.

Apple Getting Tight and SetupNever owned an iPhone or Mac but I have many model NASDAQ:AAPL charts from back when this stock was young with earning and sales growth firing on all cylinders.
The stock is holding very well in comparison to its mega siblings

Apple🍎Apple
🍎 Apple never stops amazing us, they recently announced their new iPhone, which includes "Apple Intelligence," a collaboration with chatgpt to integrate AI in a unique way, additionally, this iPhone will feature the new A18 Pro processor, which will be exclusive to this model and available for upgrade on the iPhone 15.
📱 Over the past five years, we’ve seen something cool with Apple’s stock when they launch a new iPhone, initially right after the launch, the stock tends to drop or stay flat because the initial reaction is often somewhat negative.
📈 But here’s the interesting part, in the 60 days following, the stock usually recovers and rises, unless the new iPhone proves to be less impressive than expected.
📊 In this case, things could be different, expectations are high because apple’s new release promises to be super innovative, it’s expected that apple Intelligence and the upcoming update cycle will push NASDAQ:AAPL market capitalization to over $4 trillion by 2025. This could change the pattern of the past 5 years and make the stock behave differently.
👎 Pessimistic view
📉 Berkshire Hathaway just cut its position in NASDAQ:AAPL by nearly 50%, selling off 380 million shares but be careful, this doesn’t necessarily mean the stock will fall just because they’re taking profits, here’s some interesting data, the iPhone has fallen out of the top 5 smartphone sales in china, which isn’t very positive, also Apple has provided guidance for Q4 2024, which doesn’t show growth acceleration compared to the previous quarter, and the most relevant recent change luca maestri, Apple’s CFO, will step down on january 1, 2025, and will be replaced by kevan parekh, the current planning and financial analysis.
▪️This change could make investors nervous, as Maestri has been key in managing the company’s finances, we’ll need to consider this if we’re thinking about a bullish stance on the stock.
🔹Target Prices
▪️Highest $300
▪️Average $247
▪️Lowest $186
🔹Price Analysis
👨💻 In april NASDAQ:AAPL stock hit an annual low of $164, but then had a significant rebound, rising around 45% to reach $247, marking an annual high, after that it fell back 17% to $195, and then had a 15% bounce, reaching $228 between July 16 and 17.
▪️However, there was a small drop of -4 dollars, approximately -1.60%, which has not yet been recovered, i believe the price could continue to rise to cover that pending gap of 233, and then hit a new high before starting to retrace on the chart, i’ve marked the movement I’d like to see for this week, and on friday 30, a move of 5 dollars is expected, either up or down. If it’s up, it could be just the fill of the pending gap, which I think is the most likely scenario, additionally, there is a medium term gap that almost no one is considering, between 173 and 180, created from May 2 to 3.
🔹Studies
📐RSI
▪️ 60
📐MACD
▪️ Moving Average Convergence/Divergence 2.30 showing bullish movement
▪️The moving average of the MACD 1.20 accompanying with a bullish movement in volume
🤔 Do you think Apple’s new tech will be a game changer?

Apple 🍎Apple
🍎 Apple never stops amazing us, just when we thought they couldn't top themselves, they launch a new update that captivates us and makes us want to get our hands on it right away, they recently announced their new iPhone, which includes "Apple Intelligence," a collaboration with chatgpt to integrate AI in a unique way, additionally, this iPhone will feature the new A18 Pro processor, which will be exclusive to this model and available for upgrade on the iPhone 15.
📱 Over the past five years, we’ve seen something cool with Apple’s stock when they launch a new iPhone, initially right after the launch, the stock tends to drop or stay flat because the initial reaction is often somewhat negative.
📈 But here’s the interesting part, in the 60 days following, the stock usually recovers and rises, unless the new iPhone proves to be less impressive than expected.
📊 In this case, things could be different, expectations are high because apple’s new release promises to be super innovative, it’s expected that apple Intelligence and the upcoming update cycle will push NASDAQ:AAPL market capitalization to over $4 trillion by 2025. This could change the pattern of the past 5 years and make the stock behave differently.
👎 Pessimistic view
📉 Berkshire Hathaway just cut its position in NASDAQ:AAPL by nearly 50%, selling off 380 million shares but be careful, this doesn’t necessarily mean the stock will fall just because they’re taking profits, here’s some interesting data, the iPhone has fallen out of the top 5 smartphone sales in china, which isn’t very positive, also Apple has provided guidance for Q4 2024, which doesn’t show growth acceleration compared to the previous quarter, and the most relevant recent change luca maestri, Apple’s CFO, will step down on january 1, 2025, and will be replaced by kevan parekh, the current planning and financial analysis.
▪️This change could make investors nervous, as Maestri has been key in managing the company’s finances, we’ll need to consider this if we’re thinking about a bullish stance on the stock.
🔹Target Prices
▪️Highest $300
▪️Average $247
▪️Lowest $186
🔹Price Analysis
👨💻 In april NASDAQ:AAPL stock hit an annual low of 164, but then had a significant rebound, rising around 45% to reach 247, marking an annual high, after that it fell back 17% to 195, and then had a 15% bounce, reaching 228 between July 16 and 17.
▪️However, there was a small drop of -4 dollars, approximately -1.60%, which has not yet been recovered, i believe the price could continue to rise to cover that pending gap of 233, and then hit a new high before starting to retrace on the chart, i’ve marked the movement I’d like to see for this week, and on friday 30, a move of 5 dollars is expected, either up or down. If it’s up, it could be just the fill of the pending gap, which I think is the most likely scenario, additionally, there is a medium term gap that almost no one is considering, between 173 and 180, created from May 2 to 3.
🔹Studies
📐RSI
▪️ 60
📐MACD
▪️ Moving Average Convergence/Divergence 2.30 showing bullish movement
▪️The moving average of the MACD 1.20 accompanying with a bullish movement in volume
🤔 Do you think Apple’s new tech will be a game changer?

Apple: Near the summitApple should be on the last meters of the turquoise wave B. As soon as the high is established, we expect a final sell-off. For the end of the corrective movement, we have added a magenta-colored Target Zone (between $192.02 and $172.34) to the chart. Investors could establish long positions there, with stops placed around 1% below the lower edge. With the low in place, we expect a rise above the resistance at $254.30. Should this level be broken earlier, our alternative scenario (34%) will come into play. This wave count sees the last local low as the low of the magenta wave alt.(2).

AAPL OutlookPAIR:
Bullish Outlook:
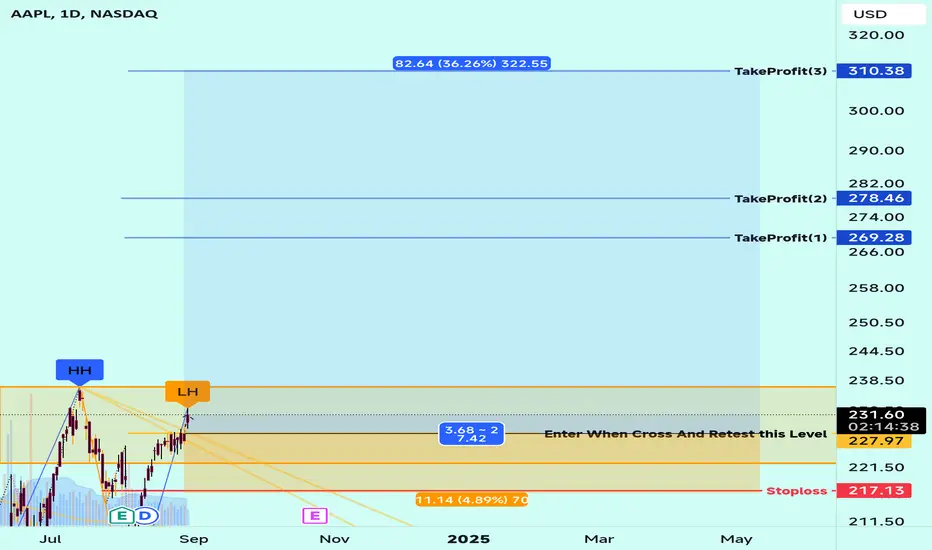
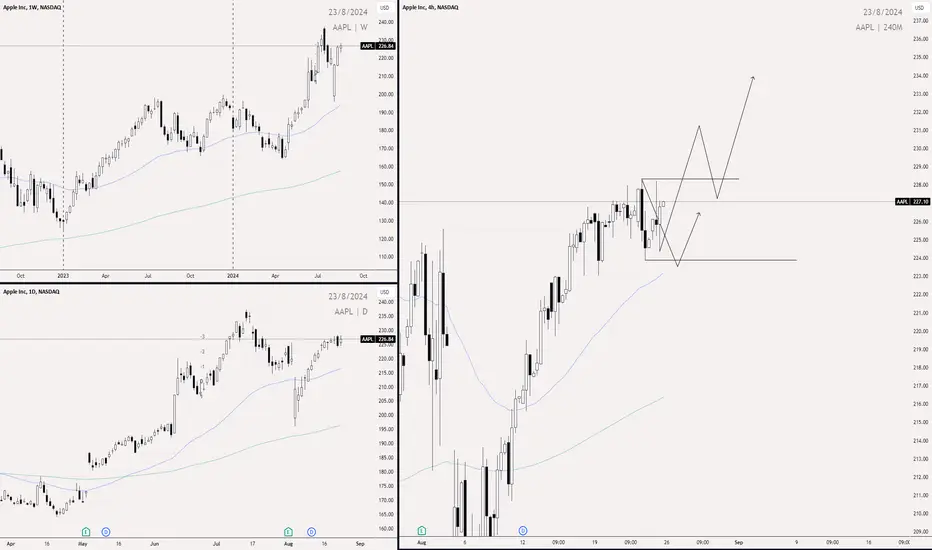
AAPL /Apple Inc. has been breaking into new highs on our Weekly, Daily, and 4hr time frame. I would like price to create a new HH and then make a valid pullback HL followed by 1 of our Valid Engulfing Patterns while staying above the 50ema.
All eyes on AAPL 👀👀👀👀
AAPL about to make a big move!
Will it be to the upside or downside, not sure, but a move is coming for sure.
As always, safe trades and not advice!

PAN_EMPP @badass_analyst takes on $APPL, predicting a $300 surgeGo long on $APPL guys, let's make this money...
enter now at current price and stay through till price reaches $300 and more, then you can start offloading.

APPLE The Target Is DOWN! SELL!
My dear subscribers,
APPLE looks like it will make a good move, and here are the details:
The market is trading on 226.81 pivot level.
Bias - Bearish
My Stop Loss - 232.38
Technical Indicators: Both Super Trend & Pivot HL indicate a highly probable Bearish continuation.
Target - 217.95
About Used Indicators:
The average true range (ATR) plays an important role in 'Supertrend' as the indicator uses ATR to calculate its value. The ATR indicator signals the degree of price volatility.
———————————
WISH YOU ALL LUCK

AAPL breakoutCheat breakout from cup and handle. Enter if breaking out above $228. Stop-loss at $223.5 and take-profit at $237.5.

AAPL: There's Nothing More Bullish than a Failed Head & ShoulderThere's Nothing More Bullish than a Failed Head & Shoulders.

Apple Stock:The 3 Step Rocket Booster StrategyFinding the Apple stock NASDAQ:AAPL
Using this strategy took about
2 weeks to form.
And after waiting it has finally appeared.
-
Waiting 2 weeks for a stock to appear
on a trading screen
can be painful especially if you are in the
the testing phase of trading
And so you want to make back the
profit that you
lost to prove a point to yourself.
Later on today i was talking to a
buddy of mine
and telling him how whenever
i needed to learn the secret
to the game
i always looked for the smartest guy
on campus to teach me the
best strategy
I would learn that strategy
and then adapt it
to my environment.
Well am going to show you
this 3 step strategy
its called the
Rocket Booster Strategy
and it has 3 steps as follows:
-The price has to be above the 50 EMA
-The price has to be above the 200 EMA
-The 50 EMA should be above the 200 EMA
Like the smartest guy on
campus with the best
strategy.
I hope this strategy will
serve you well
trade safe, you are almost
there, don't give up
you are getting smarter.
Rocket boost this content
to learn more
Disclaimer: Trading is risky you will
lose money wether you
like it or not.
Please learn
risk management
and profit-taking strategies.

$PLTR Setup - Ready to Explode I love this setup
It has a squeeze on the 30M, 15M, and 10M time frames

Downward channelIn my opinion Apple is going down from here and we will see it touching 196 before or around new iPhone launch date.
Google has released new 9 series which is making waves in the market. Plus it seems like Google has more promising and powerful eco system compared to apple. Apple clearly failed in their AI race and had to use ChatGPT to sustain. Compare that to Google that has everything now going forward to future: complete ownership of AI of all kind and flagship phone that people like, soon we will see people moving away from iPhones. I have ordered my Google 9 pro fold and excited about their AI features together with a folding screen.
Now look at the last daily candlestick, what does it indicate?
Warren Buffet sold 50% of apple for a reason!!
