easy play on ASMLI’ve been closely monitoring the monthly chart of ASML Holding (Euronext) and have identified a compelling setup that aligns with my long-term strategy. Previously, I shared an idea on TradingView with an ambitious $1200 price target, based on the stock’s strong long-term uptrend and solid fundamentals. However, upon further analysis, I’ve identified an internal trendline, which provides additional clarity and reinforces my bullish outlook. Interestingly, a similar internal trendline has been observed in other stocks like Super Micro Computer, further validating this structure.
Technical Analysis:
Primary Uptrend:
ASML is in a well-established long-term uptrend, confirmed by the primary ascending trendline connecting historical lows since 2012. This line showcases the structural strength of the stock and consistent investor confidence.
Internal Trendline Confirmation:
The recently identified internal trendline connects intermediate lows formed during price retracements, indicating a temporary slowdown in growth while maintaining an overall bullish structure.
This internal trendline has previously acted as dynamic support, suggesting it may serve as a critical reference point for future price action.
Key Price Levels:
The current price (631.5 EUR) sits near a confluence zone between horizontal support and the internal trendline. This presents a strong entry point for a long position with an attractive risk/reward ratio.
Significant support has been identified around the 600 EUR level, reinforcing my confidence in a potential price rebound.
Long-Term Price Target:
My long-term price target remains at $1200, which I believe is achievable as the stock continues to respect its bullish trend. This target aligns with ASML’s historical growth trajectory and the robust potential of the tech sector.
Entry Timing:
The recent bounce off the internal trendline and the +1.66% daily gain signal positive accumulation and increased buying interest. I plan to go long now, taking advantage of the dynamic support, with a stop loss set just below 590 EUR to manage risk effectively.
ASML Holding offers a compelling investment opportunity, supported by a solid technical structure and clear bullish potential. The internal trendline, combined with horizontal support and the broader long-term uptrend, strengthens my confidence in entering a long position. With a $1200 target and a well-defined risk management plan, I believe this is the right time to position for the next leg up in this stock.
ASME trade ideas

asml head n shoulders bottom in actlook the chart, as i said 15 days ago , in a comment on asml, is forming an head n shoulders bottom reversal, in 1d chart, driving the AI power for ASML that has a total supreme monopoly in chip, for the next generation of advanced AI drive CHIPS.

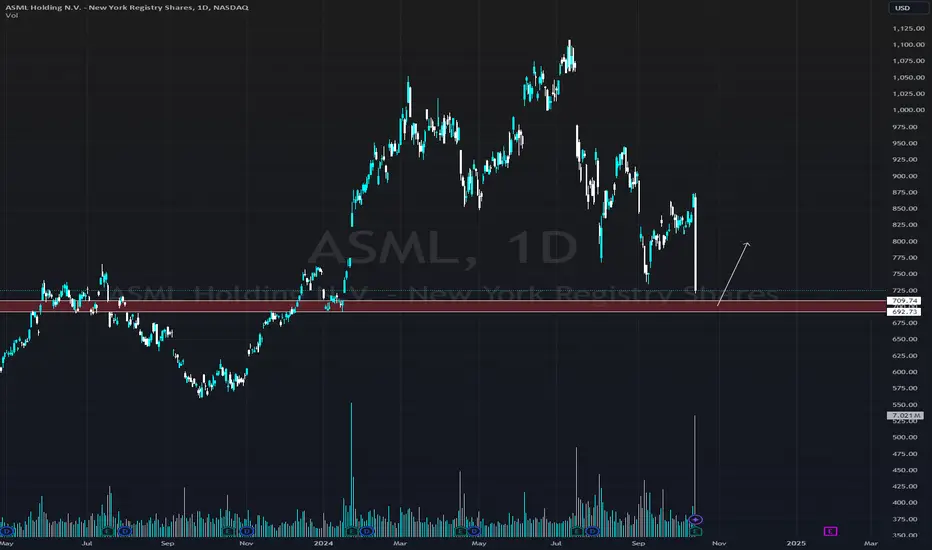
ASML: A Key Player in Semiconductors- attractive risk/rewardASML Holding is a critically important company in the semiconductor industry because its components are used in the production of most semiconductors globally. Their unique technology gives them a strong position in the market.
Looking at the price action, the stock was trading around $700 back in April 2021 when the company had $5.25 billion in revenue and an EPS of $3.86. Fast forward to October 2024, revenue increased to $8.14 billion (a 55% increase), and EPS grew to $5.75 (a 49% increase).
Despite this significant growth, the stock is down over 35% from its highs of $1,100 set this July.
To me, this presents an excellent risk-reward opportunity, and I’m in at $688.

ASML Wedge BreakoutFor the market to continue its upward trajectory,
the semiconductor sector needs to show strength,
with ASML playing a critical role it needs to go higher,
After a period of consolidation, ASML forming a wedge breakout pattern,
Worth a try.

ASML is no longer bullish🔴 ASML is no longer bullish
EURONEXT:ASML is one of the most interesting companies in Europe by far, but recently has broken a very large trendline meaning that at least, we are moving to a NEUTRAL or BEARISH market.
✅ What pattern is unfolding in EURONEXT:ASML ?
The pattern is one of the simplest that exist. A simple trendline, but look, is a very large trendline of more than 5 years and multiple touches. Breaking this kind of pattern is a major signal that you can't avoid.
💰 How to trade this chart pattern?
Once the trendline is broken, you can trade in any pullback or any new low done, searching for the upcoming bear market. Take care with longs here, you are probably seen a dead bounce cat.
✴️ ENJOY AND FOLLOW for more ideas 😊

Poised for a breakout to mid 700 oversold and consolidatingThe stochastic and rsi are on an uptrend halfway; there are signs of a squeeze from the Keltner and Bollinger, a sideway pattern pursuing a pattern close to its breakout. Target 760

ASML Trade Idea: Riding the Uptrend with CautionAfter some time away, I’m back with a fresh ASML setup. I’ll keep this analysis simple and focus on the key points.
Market Structure and Trend Analysis
ASML remains in a strong uptrend on higher timeframes, although there has been a Change of Character (CHOCH) on the shorter-term trend, indicating a corrective phase.
This recent pullback looks like a corrective pattern within the larger monthly uptrend, potentially offering a buying opportunity if the main trend resumes.
Technical Overview
The price has tested the trendline for the third time and briefly dropped below it, which could attract short sellers and create liquidity for larger players.
I’m eyeing the -27% Fibonacci extension as a full-wave target for this setup, but I plan to take partial profits along the way, starting with 25% at a 1:3 risk-to-reward ratio.
Risk Management and Seasonal Insights
I’m risking 1% of my account on this trade, maintaining a conservative approach.
Additionally, we’re currently in the “Halloween Effect” period, where the market often performs well from October through December, providing a seasonal tailwind.
Fundamental Context
Recent negative news around ASML may create a bearish narrative that could mislead retail traders. I interpret this as a buying opportunity, aligning with the overall bullish trend and offering a favorable risk-to-reward setup.

ASML a good deal?Negative earnings were leaked, insiders sold before the news was released. It’s clear not everyone plays the game by the rules. So trade carefully in this volatile market.
I posted an idea on the SPX looking like it’s topping out. But certain stocks present buy opportunities as they may go one wave higher. ASML is one of them.
We just entered a buy zone area for me, I will be laddering in.
We failed to break out of the RSI downtrend but I expect it to break out on the next attempt. I believe we are in a fourth wave correction of a larger 5 wave move up. If the diagonal trend line doesn’t hold as support, or the Fibonacci golden pocket retracement level, consider getting out to protect capital as risk management is important in this Wild West market.
Not financial advise

Incoming 60% correction for ASML HoldingOn the above weekly chart price action has seen a strong 200% upward move since 2022. No doubt a move in part caused by the AI mania.
Is now a good time to buy?
Seeking alpha says “Buy the dip”
“ASML has returned to growth after revenue declines, with flat revenue expected for 2024 and growth anticipated in 2025, driven by new EUV tools.”
“Despite a 53% QoQ drop in net bookings, ASML's backlog remains strong at €36B, supporting a revised 2025 revenue outlook of €30-35B.”
A quick Google leads to no shortage of “buy the dip” articles. But then again, Google is not what it once was, with many paid for bias articles are evident.
The best News and outlook will always be the chart.
On the above weekly chart:
1) Price action and RSI support failures.
2) Broken market structure.
3) Look left, support and resistance, red arrows. The 2021 market top confirms resistance in October 2024. This is a significant warning.
4) The bear flag. It is has not yet confirmed, but a breakout is evident. A back test would be ideal, towards $800 area. The flag forecasts a 60% correction to support.
Is it possible price action continues to rise? Sure.
Is it probable? No.
Ww
Type: trade, short from $800

ASML: A Key Moment to Take Advantage of Bearish SentimentCurrent Context
ASML Holding N.V. (NASDAQ: ASML) is at a critical juncture. Recently, its share price has fallen nearly 24%, driven by a downward revision to its 2025 sales projections largely because +20% of its sales were being generated by China and now the country has seen competitors replace its best-selling technologies. Sales are now expected to range between 30 and 35 billion euros, compared to the previous forecast of 30 to 40 billion. This revision is due to a slower recovery in its traditional markets, especially in logic chip production and limited production capacity in the memory sector.
Operational Analysis
Despite this pessimistic review, ASML's growth prospects remain robust. The company maintains a dominant position thanks to its monopoly in extreme ultraviolet (EUV) lithography technology, crucial at a time when demand for advanced semiconductor manufacturing equipment is on the rise, driven by artificial intelligence, 5G and digital transformation. Although relations with China have weakened thanks to European interventionist policies, ASML anticipates that growth in segments outside China will offset this decline. The growing need for advanced semiconductors is expected to continue to support its growth in the medium term.
Valuation Analysis
From a valuation standpoint, ASML presents itself as an attractive opportunity. It currently has an EV/sales ratio of 9.5, which is 18.9% below its five-year average. It is estimated that the company's value could increase 30% in the next 12 months, reaching approximately $360 billion, based on revenue projections of $36 billion by 2025. Furthermore, with a non-GAAP P/E of 34.5, which is also below its historical average, ASML appears undervalued compared to other industry players.
Technical Analysis
From a technical point of view the stock has been losing value since July 11. The last strong downward movement occurred on October 15, subsequently the downward pressure has kept the stock during the whole month and the beginning of November down. A bearish delta channel is visible and clearly marked by the POC price around €627 per share. This price retracement has caused the stock to reach December 2023 prices, prior to the Christmas rally. At the moment RSI is oversold at 32.49% so it is not strange if the firm's share price recovers value towards €753 which is the last delta pressure zone indicated in the next trading area.
Risks to Consider
However, not everything is positive. Geopolitical tensions between the US and China could significantly impact ASML's valuation. China accounts for more than 20% of the country's sales and it is a very high risk for the company to lose this major market because it is the market that can be a competitor with global suppliers and government support. The emergence of Shanghai Micro Electronics Equipment (SMEE), which receives subsidies from the Chinese government, represents a long-term challenge. While these concerns may seem distant, it is essential not to underestimate their potential effect on the market.
Conclusion
Despite the risks, the combination of ASML's current valuation and its monopoly in EUV technology suggests that it is an appropriate time for investors to consider a position in this stock. With a solid growth outlook and favorable investment conditions, ASML is positioned as a strategic buy in a well-managed portfolio.
Ion Jauregui – ActivTrades Analyst
*******************************************************************************************
The information provided does not constitute investment research. The material has not been prepared in accordance with the legal requirements designed to promote the independence of investment research and such should be considered a marketing communication.
All information has been prepared by ActivTrades ("AT"). The information does not contain a record of AT's prices, or an offer of or solicitation for a transaction in any financial instrument. No representation or warranty is given as to the accuracy or completeness of this information.
Any material provided does not have regard to the specific investment objective and financial situation of any person who may receive it. Past performance is not reliable indicator of future performance. AT provides an execution-only service. Consequently, any person acing on the information provided does so at their own risk.

ASMLASML's stock is rising within an upward channel, and at the upper limit of the channel, a trap was set with a double top (2B Pattern) around $1000.5-$1000.7. It broke the channel and closed above it, then returned to close within the channel again by gap. Following that, it quickly declined, breaking the upward trend. Now, we have two scenarios: either a direct decline towards two strong demand zones first zone (615$_586$) second zone(523.5$_494.17$) , where we will wait for action and the emergence of buyers before entering, or a rise to retest the broken trend line before declining to the two demand zones After reaching the two demand zones and the emergence of buyers, we will aim to rise towards the red zone (800$_900$).

Yes, there is a huge bull flagAs many other stocks, punished by the algos, ASML has created a bull flag like in tesla, offering a 40% of return.

ASML KEY S/R ZONE ON THE WEEKLY! MOAT COMPANY! 55% UPSIDE! NASDAQ:ASML just did a Wykoff under it's key Support/ Resistance zone over the last 5 years on the weekly chart! If we hold here and start to bounce upward on the chart, MACD, Stochastic, and RSI we could be in for a major upward move back to All time highs! I don't believe the sell off has been way over done for such a solid MOAT company!

ASML Growing Strongly Despite Falling Order Bookings
ASML Holding N.V., one of the leading technology suppliers in the semiconductor industry, has reported its financial results for the third quarter of 2024, reporting solid growth despite the challenges faced. The company achieved net sales of €7.5 billion, representing a 20% increase over the previous quarter. This growth was driven mainly by demand for its advanced lithography systems, essential for chip manufacturing, with sales of 106 systems in the latest quarter, up 19% from the year-earlier period.
However, ASML is facing a notable decline in net orders, which fell by 53%. This drop reflects a near-term slowdown in demand, forcing the company to adjust its expectations for fiscal 2025. ASML has revised down its revenue projection, now estimating between €30 billion and €35 billion, a sign that uncertainty in the market could affect its future performance.
Despite these challenges, ASML maintains a robust gross margin of over 50%, demonstrating its ability to remain profitable even in a challenging economic environment. In addition, free cash flow also improved significantly, reaching €534 million, with a margin of 7%, which strengthens its financial position and its ability to cope with the conditions of a challenging economic environment.
On the technical side, the company has lost value from the $1,110.09 it was valued at in July, to the $677.12 to which it plummeted between its highs and October 16, especially the latest results have affected to reduce its value by almost -23% in a matter of 2 trading days. On Friday its shares partially recovered in price and a recovery could be seen as the company is highly oversold at 37.77% and its checkpoint marks us that the average trading zone is located in the direction of $920. The delta indicator marks a zone to return to near $735, so if we begin to see signs of price recovery. It means that the company has a chance of a partial price recovery.
With growing global demand for semiconductors driven by emerging technologies such as artificial intelligence, ASML remains a key player in the sector. Its ability to innovate and stay on the cutting edge of technology makes it an attractive option for long-term investors, despite volatility in orders.
Ion Jauregui – ActivTrades Analyst
*******************************************************************************************
The information provided does not constitute investment research. The material has not been prepared in accordance with the legal requirements designed to promote the independence of investment research and such should be considered a marketing communication.
All information has been prepared by ActivTrades ("AT"). The information does not contain a record of AT's prices, or an offer of or solicitation for a transaction in any financial instrument. No representation or warranty is given as to the accuracy or completeness of this information.
Any material provided does not have regard to the specific investment objective and financial situation of any person who may receive it. Past performance is not reliable indicator of future performance. AT provides an execution-only service. Consequently, any person acing on the information provided does so at their own risk.

ASML eyes on $675 then 600: Earnings drop to support a buy? ASML dropped to a significant sujpport after earnings.
More dip to major support below would be ideal buy.
Many dark clouds above, so scalps or long term adds.
$ 673.43 - 677.93 is immediate but moderate support.
$ 591.87 - 603.14 is Major support plus round number
$ 730.99 - 743.81 is the fist resistance to break above.
===============================================
.

SELLS ON ASML💡 Today we analyze ASML Holding N.V. (ASML)
ASML has performed well since October 2022, but currently shows signs of weakness.
1. Break of bullish trend: Since July 2024, the stock has broken its bullish trend.
2. Bearish trend: A new bearish trend has formed with decreasing lows, indicating a possible continuation of the decline.
3. Technical analysis: A clear break above the bearish trend established since 2019 would require the price to exceed €800.
4. Macroeconomic factors: Economic uncertainty and the potential slowdown in demand for semiconductors could affect ASML’s projections.
This analysis is not an investment recommendation.

ASML road to 11560Buy the dip they said, youll be rich they said. Well, i realy think this is it! At least for ASML. The compamy is the only one in the world who build machines that can produce chips. We live in a time with ai getting more advanced and i dont see ASML not being thge biggest player here. Lets see what the future brings.

ASML (ASML): Massive Sell-Off - What's next after the $50B loss?We are sure you’ve heard about ASML’s massive drop yesterday, erasing $50 billion in market value within hours following a technical error and the earnings report published a day earlier. ASML, Europe's most valuable tech company and a critical supplier to chipmakers, is now facing doubts—not about its long-term prospects but regarding short-term sales and whether it can continue to outperform the market in the long term.
As always, we’re not focused on intraday trades but are looking for bigger, high-risk-to-reward swing trade setups. To assess this, we’re turning to the Weekly chart to analyze ASML’s most important levels. Our most likely scenario at this point is that the All-Time High represents a wave B, after exactly respecting the 138% Fibonacci extension level. Coupled with the bearish divergence on the RSI, this pullback was expected.
While it's difficult to predict the exact point of reversal, we see $600 as a major psychological support level that could hold in the short term. To reverse the current downtrend, ASML must break above the resistance zone of $850–$895. However, as this is a potential wave ((ii)), even reaching the All-Time High is not out of the question. Merely reclaiming this resistance zone might not be enough to signal a trend change.
We’re keeping an eye on all major support zones, but the largest position we plan to open would be between $250 and $140. While this is still far off, and there will likely be opportunities along the way, this zone would provide the most textbook setup according to Elliott Wave Theory. The recent dip has also opened up more potential plays for the future.
Stay tuned as we monitor the situation for further developments! 🔥

Long Term setup. Watch broken support or nextLong term investment. This stock have declined sharply in the last 2 days since report came before scheduled announcement. Projections on forecast earning 2025 are expected to be lower now since last report. This stock is the foundation of all semiconductors. On the negative side is about the pressure from USA if they continuing selling product to China.
LONG TERM TARGET 2000$. Enjoy and keep it clean.

ASML Holding Falls! Short Trade Hits TP1, More Targets AheadASML Holding has shown a strong bearish movement, reaching Take Profit 1 (TP1) at 742.16.
Key Levels
Entry: 792.37 – A short position was initiated at this level, guided by the precision of the Risological Swing Trader.
Stop-Loss (SL): 832.99 – Positioned above recent resistance to protect against a potential reversal.
Take Profit 1 (TP1): 742.16 – Already achieved, confirming the effectiveness of the short setup.
Take Profit 2 (TP2): 660.92 – The next target in line as downward momentum continues.
Take Profit 3 (TP3): 579.68 – A further target if the bearish trend persists.
Take Profit 4 (TP4): 529.48 – The ultimate target, indicating a significant decline.
Trend Analysis
The price is moving firmly below the Risological Dotted trendline, indicating a strong downtrend. The sustained bearish pressure suggests the potential for further declines towards TP2 and beyond.
With TP1 already hit, ASML Holding continues to show promise for further downside, guided by the Risological Swing Trader. The short trade remains positioned to capture additional opportunities as the trend continues to favor the bears.

ASML correcting lower against October-2022 lowASML favors pullback in correction against October-2022 low in possible zigzag or complex correction. It favors lower in 5 of (A) and soon can bounce in (B) against July-2024 high.

LOOKING CERTAIN to the downward movement on catalystThe catalyst was suitable as both revenues and EPS were beaten, and future earnings see a bigger jump, making it better, but due to the glitch and other technical pointing to a continuing pattern, a 5-10% change may still be in play and not priced in.