BRH trade ideas

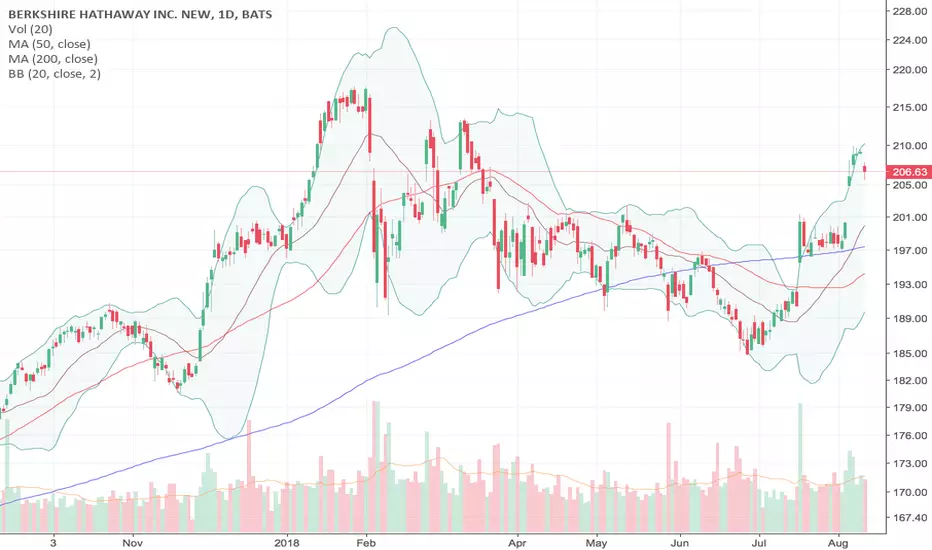
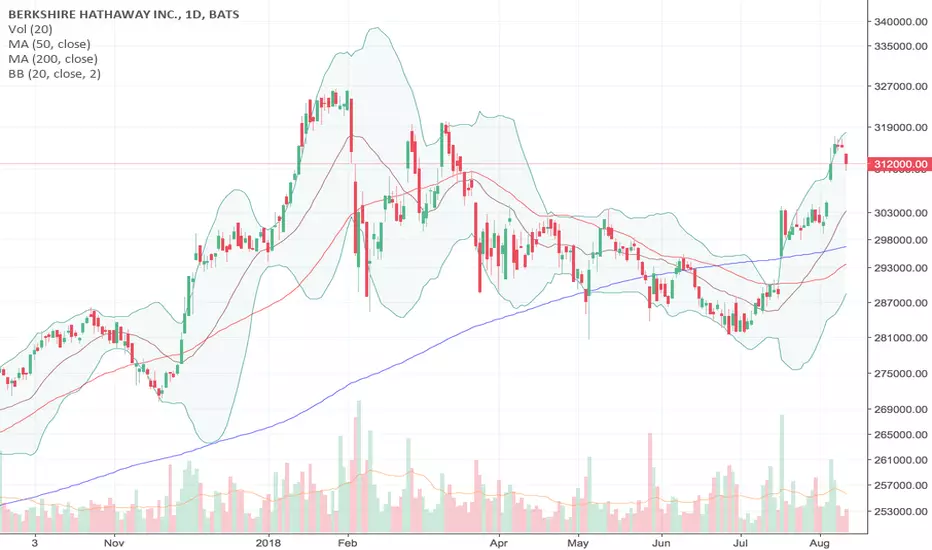
Berkshire HathawayAs you can see from the monthly cart, Berkshires growth is steady and consistent, this is probably because they are owned by in my opinion 1 of the worlds best ever investors... Warren Buffett.... if you don't know who he is then you clearly should not be investing.
We are long on this position with no real TP as this is a long term investment, but obviously we have a SL as trading anything without a SL is just stupid.

Why I'm Not Worrying About Warren Buffett's Record Stash of CashThe logic is deceptively simple: Buffett piles up cash when the market is too expensive and about to crash. That's a poor look at the data.
"Why I Am Not Worrying About Warren Buffett's Record Stash of Cash"
drduru.com
Why I'm Not Worrying About Warren Buffett's Record Stash of CashThe logic is deceptively simple: Buffett piles up cash when the market is too expensive and about to crash. That's a poor look at the data.
"Why I Am Not Worrying About Warren Buffett's Record Stash of Cash"
drduru.com $SPY $BRK.A $BRK.B

Up..Up..and AWAY! LONGBERK.B looks GREAT!
Indicators are strong and trending up.
Looking for it to break $217
BOUGHT 5000 SHARES - PURCHASE PRICE $197.55

$BRK.BReach my target to the downside, took a while.
Looking to start a new position next week, lets see if it holds.

BERKSHIRE HATHAWAY INC. A bullish divergence (Price/CCI) on BERKSHIRE HATHAWAY with the breakout of the resistance trendline on Friday. The target area at $ 212.00/213.50 and the stop loss at $ 183.75/184.00.


Berkshire Hathaway A [Long term analysis]Good 'ol Berkshire Hathaway Class A shares.
Looks like BRK.A is at a potential reversal zone, and this could be a good chance to either a) Short until desired targets or b) Wait for support and signs of reversal at the 23.6%, 38.2% or 50%. If we do indeed reverse at this zone, this will be our wave 4 correction yielding an extended wave 5 afterward.
According to Elliot Wave theory if a third wave fails to make it past 1.618x of the initial wave 1, you can expect an extended wave 5 which will have targets of 1.0x, 1.618x or 2.618x of wave 1 to 3 projected from the wave 4 bottom. This count is invalidated if we close above $330,000 on the M1 interval.
The R:R on this position would be about 1:3.5
A brief recap of BRK.A drops:
3/1973 - 1/1975 - 59.1% drop (S&P lost 44%) - US economy in recession resulting from oil crisis and fallout from Breton Woods Agreement.
10/1987 - 10/1987 - 37.1% drop (S&P lost 34%) - Black Monday Stock crash.
6/1998 - 3/2000 - 48.9% drop (S&P gained 27%) - Just before dot-com bubble burst.
9/2008 - 3/2009 - 50.7% drop - The darkest days of the great financial crisis.
S/L: $330,000
Entry : $296,000
Target 1: 23.6% / $258,570
Target 2: 38.2% / $223,051
Target 3: 50% / $194,334
"If you can keep your head when all about you are losing theirs...
If you can wait and not be tired by waiting...
If you can think - and not make thoughts your aim...
If you can trust yourself when all men doubt you...
Yours is the Earth and everything that is in it."

Inverse Berkshire Hathaway: Short Buffet?Just something that came up in the KHL chatroom. Looks like an explosive downtrend, if you flip it over, looks even clearer...as a massive uptrend signal.
Let's see how it goes. I'm flat, won't trade it, but definitely interesting to observe.
Cheers,
Ivan Labrie.


Berkshire Hathaway As An IndicatorHello friends. It's probably hard to find out what the smart money is doing. I think some iconic companies have more overall predictive power than others. About 3 weeks later after the news was published we can see if there is any impact.
"Because of accounting rule changes, however, the conglomerate recorded a first quarter loss of $1.1 billion, compared to net income of $4 billion in last year's first quarter"
www.cnbc.com

Price is in the period of adjustment down to the Q2 - 2019Technical Analysis:
In long term view, prices are in the cumulative sizewave area with lower peak.
In the medium term, the buying power is weakening, not breaking the previous resistance.
In the above analysis buy zone:
The strong psychological dispute occurred in the 50 fibo area, there is a possibility of price adjustment down here appears the strong buy and recover to the old peak.
If in the long term the third quarter of 2019, strong buying power still does not make the price increase from the old peak, prices will fall sharply in the double pattern.
In my opinion, technically and based on our analytical method, the price of this top stock reflects the general market situation, so if it falls sharply, it is a sign of the upcoming economic downturn. .

Long-term logarithmic viewBRK.B since inception on log view with 200 day exp moving average. We see that we are in a late cycle boom now, and quite far from the 200d EMA. May go up in short-term as others have suggested, but I would SHORT in the long term and wait for prices to cross EMA before going LONG.

Short BRK.B for shooting star at kumo resistance levelShort BRK.B for shooting star at kumo resistance level

BRK.B bullish bias next few days5 and 50 is your friend.
Strong push thru the 50 SMA so going bullish for next few days.
Please create your own TP and SL if you do not agree with mine.
The importance factor is the direction this pair is heading.
Use this as entertainment only.


Wall Street's Superstar Dealt Shocking Blow from the ScimitarBuffet's facing a grim New Dawn this fine 21st century...

