CHV trade ideas


Chevron - CVX - Daily Market ReportCVX : NYSE
123.61 : 09/19/2019 : 1742 ET Change: -0.58 (-0.47%)
Medium Bull Mode
Report Type = Macro, End of Day
ABOUT US
Strategydb's focus is to bring forth key analytics and decision support tools that the entire trading and professional investment community can use, and profit from.
DISCLAIMER
THE RISK OF LOSS IN TRADING CAN BE SUBSTANTIAL! YOU SHOULD THEREFORE CAREFULLY CONSIDER WHETHER SUCH TRADING IS SUITABLE FOR YOU IN LIGHT OF YOUR CURRENT FINANCIAL CONDITION. IN CONSIDERING WHETHER TO TRADE OR TO AUTHORIZE SOMEONE ELSE TO TRADE FOR YOU, REMEMBER THAT PAST PERFORMANCE IS NOT NECESSARILY INDICATIVE OF FUTURE RESULTS.
Charts by TradingView
Please edit 'ES1!' and input the symbol that matches our report, or the symbol of your choice.
Categories that are currently turned on:
Market Behavior
Transitions
Standard Analysis
Advice
Natural Attraction
Support / Resistance
SpeedView
Price Projections
Common Technicals
Help System
Strategydb believe that standardized and repetitive analysis instills discipline in trading. Reports list major areas of interest that should be considered when performing technical analysis and / or creating a trading plan.
Market Mode of Behavior: CVX : NYSE : 123.61 : Macro: Eight specific set-ups that dictate the current trading strategy...
Currently, this market meets the Medium Bull Mode criteria. Price is trending higher.
For the entire data set this market has been in Medium Bull Mode 9.89% of the time.
The average number of bars spent in this Mode before transitioning normally = 13. Since the current number of bars in Mode = 14, this market may transition into a new behavior soon.
The average price growth during this behavior is approximately = 2.24. This is compared to the current price growth of 6.09. Based upon the closing price of the most recent bar, price growth has been exceeded.
Back to Top
Transitions & Time: CVX : NYSE : 123.61 : Macro: Background on the current Mode of Behavior...
Transition from Volatile Bear Mode occurred 14 bar(s) ago.
According to our signal logic, this transition occurred abnormally! A logical transition from one Mode of Behavior to another has NOT occured. We advise waiting for the next transition into Volatile Mode before trading again.
Possessing knowledge of the preceding Mode of Behavior as well as the most likely subsequent Mode assists in executing current strategies, exits, and setups for the next trade.
Back to Top
Standard Analysis: CVX : NYSE : 123.61 : Macro: A closer look at the current Mode of Behavior...
The current bar's close at 123.61 demonstrates that prices should continue higher.
Cautionary price levels 4.18% below the market are outside the Average True Range price percentage window of 1.68%, currently lowering the short-term probability of transitioning out of Medium Bull Mode.
The Average True Range price percentage window is simply a function of the 16 bar Average True Range, divided by the underlying's closing price of the last bar. Cautionary price levels are proprietary. Prices in this region indicate possible Mode transitions.
Volatility based on the 30 day standard deviation = 21.07%. Volatility based upon the 30 day Average True Range = 2.08 points, (based upon the underlying's price scale.)
The price change versus 1 week ago = 2.11. The price change versus 1 month ago = 5.89. The price change versus 1 year ago = 14.82.
Back to Top
Advice: CVX : NYSE : 123.61 : Macro: Straight-forward wisdom on how to position for near-term profits...
Alert! Transactions in FOREX, Futures, and Stocks, carry a high degree of risk. No slippage or commissions are included here or in our Statistics tables. Your FCM will charge you a commission.
In Transition & Time, we noted that a logical transition from one Mode of Behavior to another has NOT occured, and previously advised waiting for the next transition into Volatile Mode before trading again. If you must trade, are obligated to trade, or already have a position, please use the 'standard' Mode of Behaivior advice provided here with extreme caution as volatility may be increasing dramatically.
Range trade this market from the long side. Buy dips. Do not trend trade. Place buy orders to establish longs above recent lows.
During Medium Bull Mode longer time-frame traders disagree with short and medium time-frame traders. Medium-term banded ranges occur with a bullish slope. (++-)
Back to Top
Natural Attraction: CVX : NYSE : 123.61 : Macro: Expected tendencies and targets...
During Medium Bull Mode prices should tend towards a price structure located at 128.35.
Back to Top
Support & Resistance: CVX : NYSE : 123.61 : Macro: Specific trading levels or bands...
SPEEDVIEW TRADING WIDGET
A key level to watch, located at 117.43 is exactly 6.18 points, or 5.0% away.
Trading Band6 Level = 129.88
Trading Band5 Level = 127.80
Trading Band4 Level = 125.72
Trading Band3 Level = 123.64
Trading Band2 Level = 121.56
Trading Band1 Level = 119.48
Back to Top
Price Growth / Decay Projections: CVX : NYSE : 123.61 : Macro: Growth / decay projections...
Target#1 Hit @ 119.80
Target#2 Hit @ 123.17
Back to Top
Common Technicals: CVX : NYSE : 123.61 : Macro: Values for commonly used technical analysis indicators...
Macro = Daily Bars...
Momentum Indicators
09 Day RSI = 68.72
10 Day RSI = 67.34
14 Day RSI = 62.69
Moving Averages
003 Bar MA = 123.90
004 Bar MA = 123.95
005 Bar MA = 123.46
008 Bar MA = 122.73
010 Bar MA = 121.95
014 Bar MA = 120.60
018 Bar MA = 119.68
020 Bar MA = 119.36
030 Bar MA = 119.29
040 Bar MA = 119.96
050 Bar MA = 121.04
100 Bar MA = 120.92
200 Bar MA = 119.36
Oscillators
12,26 Day MACD = 1.12
9 Day Smoothed MACD = 0.32
Difference = 0.80
Volatility
20 Period Bollinger Bands +2 Devs = 124.77
20 Period Bollinger Bands -2 Devs = 113.38
Wilder Parabolic Stop and Reverse
ParabolicSAR = 117.40

CVX Iron CondorCVX Iron Condor Strategy
110/115/125/130
Seems very lackluster in terms of the movement, rsi is rising but OBV is bearish.
Price movement is weak.
Credit is very nice on a condor. $1.53 Credit on this strategy
Looking to exit first week of October for $90 credit.
Max loss is $180.

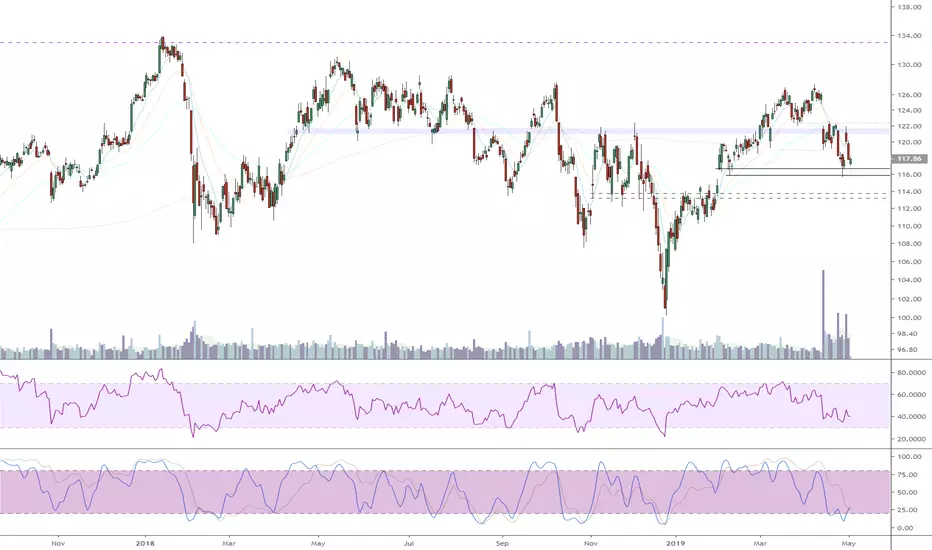
Chevron looks very much like a major breakout ahead. Given the turbulent times and what looks to be a spike in oil prices, it is not unthinkable that a multiyear breakout is ahead. Add to the mix a great yield of 4-5%, CVX should offer some fantastic rewards in the short term.
Chevron Corp. engages in the provision of administrative, financial management, and technology support for energy and chemical operations. It operates through the Upstream and Downstream segments. The Upstream segment consists of exploration, development, and production of crude oil and natural gas; liquefaction, transportation, and regasification associated with liquefied natural gas; transporting crude oil by major international oil export pipelines; processing, transporting, storage, and marketing of natural gas; and a gas-to-liquids plant. The Downstream segment comprises refining of crude oil into petroleum products; marketing of crude oil and refined products; transporting of crude oil and refined products by pipeline, marine vessel, motor equipment, and rail car; and manufacturing and marketing of commodity petrochemicals, plastics for industrial uses, and fuel and lubricant additives. The company was founded in 1906 and is headquartered in San Ramon, CA.

CVX long setupCVX’s innovation outlook is trending down based on a current score of 77 out of 99, outperforming sector average. Jobs growth over the past year has decreased and insiders sentiment is negative. CVX is an Average Performer in terms of sustainability. It is most exposed to BP p.l.c. as its supplier. Over the past 4 quarters CVX beat earnings estimates 3 times and it pays dividend lower than its peers.
For more analysis and articles visit our website
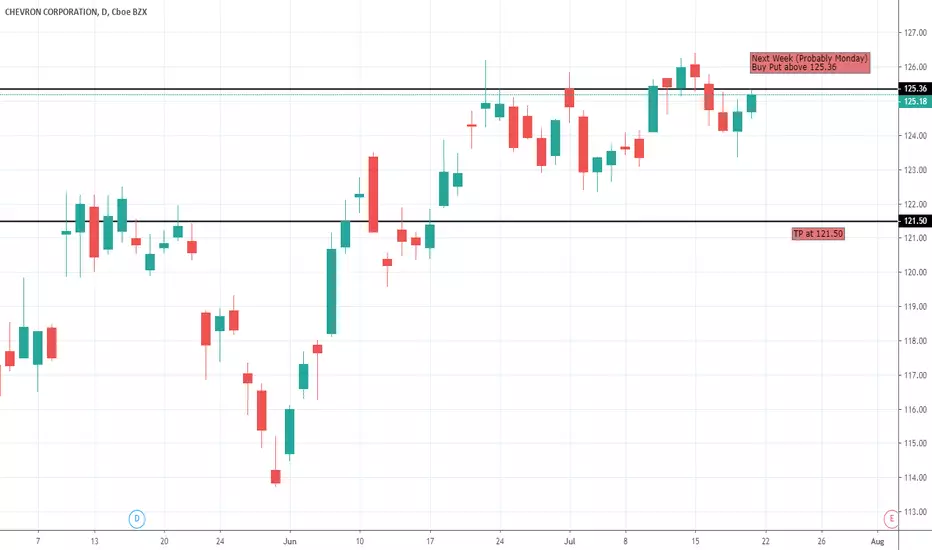
CVX - Potential Short (Buy Put)CVX - Potential Short (Buy Put) - Looking to go short if I get the right trade entry signal.


Chevron (CVX) Next Week - Buy a Put above 125.33Chevron (CVX) Next Week (Probably Monday) - Buy a Put above 125.33, TP 121.50

CVX may go down now! 125.66 is holding at multiple time frame CVX may go down now! 125.66 is holding at multiple time frame resistance and crude oil at major resistance.


BEARS ARE TRYING PUSH THE CHEVRON CORPORATION DOWNSHORT
TEAR DOWN FOR "CVX" IN UPCOMING DAYS TO COME!!!!!!! RAW PRICE ACTION ANALYSIS!


Chevron: Better with Cash than AnadarkoWell, OXY outbid them on Anadarko, but the market seems to be cheering CVX for that. They're posing a strong rally against the current market headwinds, and volume spiked yesterday along with a solid 3.14% earnings. The MACD histogram just broke positive, so the MACD may break positive soon after if this holds. DM+ just crossed over DM-, and RSI just crossed above 50. You may want to wait for more confirmation, but you also might be missing out on the post-earnings announcement drift on this one if you wait too long. Money flow is still negative but rising, so the big money players are eyeing Chevron as a haven to weather this looming correction.

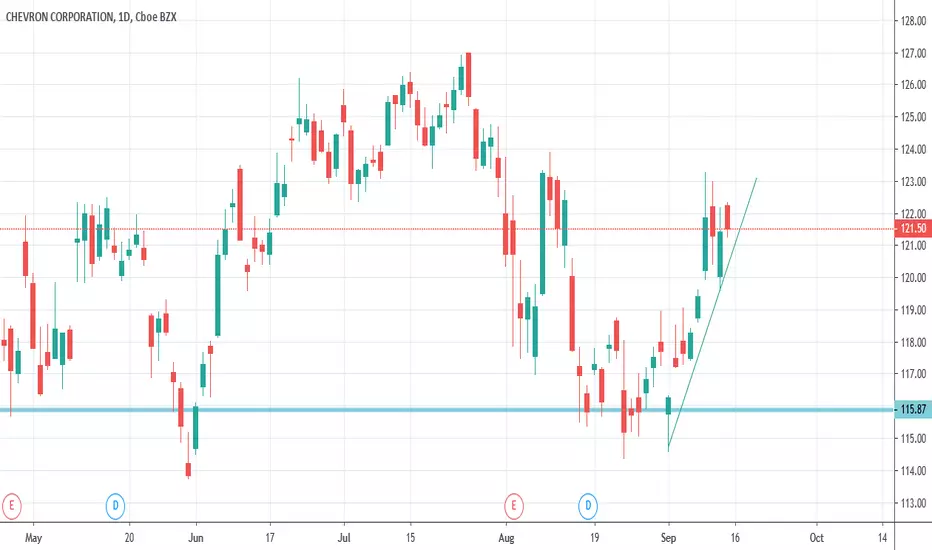
Long CVX - Monthly Time frame - Daily RR entryIdea would be to:
Buy into the daily range low here.
Stop at 115.80s for the first few days of the trade
--
Objective: Higher time frame position, looking at the weekly and monthly.
Chevron, Corporation (CVX)(NYSE) Sell $122.00 >>> Target $125.00NYSE:CVX
Chevron, Corporation
Stock - NYSE (USA)
Profit:Risk = 1:1
---
Buy = $122.00
Take Profit = $125.00
Stop Loss = $118.99
------
Take Profit = +2.46%
Stop Loss = -2.47%


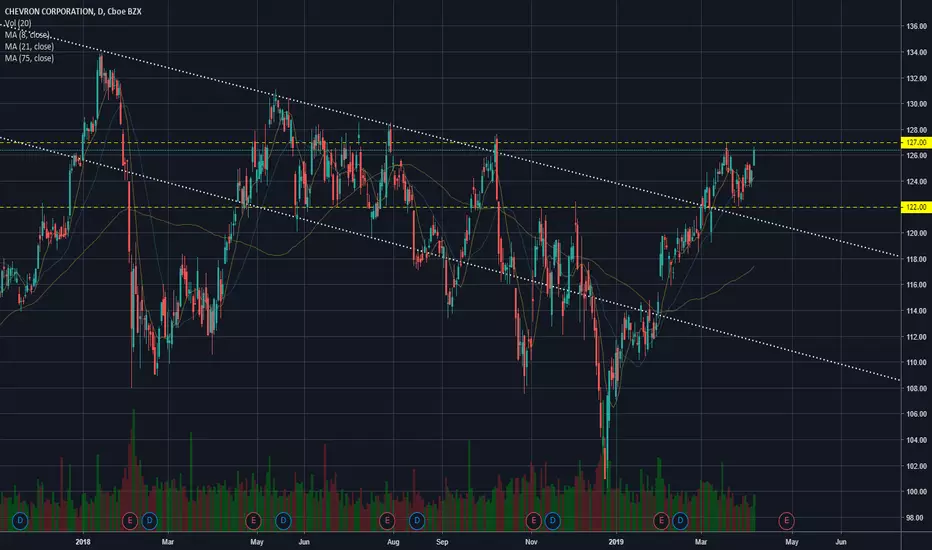
CVX through 127Looking for some consolidation under the level.
Wide stops will keep you in the trade, you can trail the MA's to stay in the big picture move