CHV trade ideas

Chevron - Wave 5 BeginningCVX showed a bullish divergence (1 hour chart) with Price/RSI on 5/29 - 5/30 and currently looks poised to follow a move up with oil price. Price target of ~$135, or a ~9% increase from current price level.

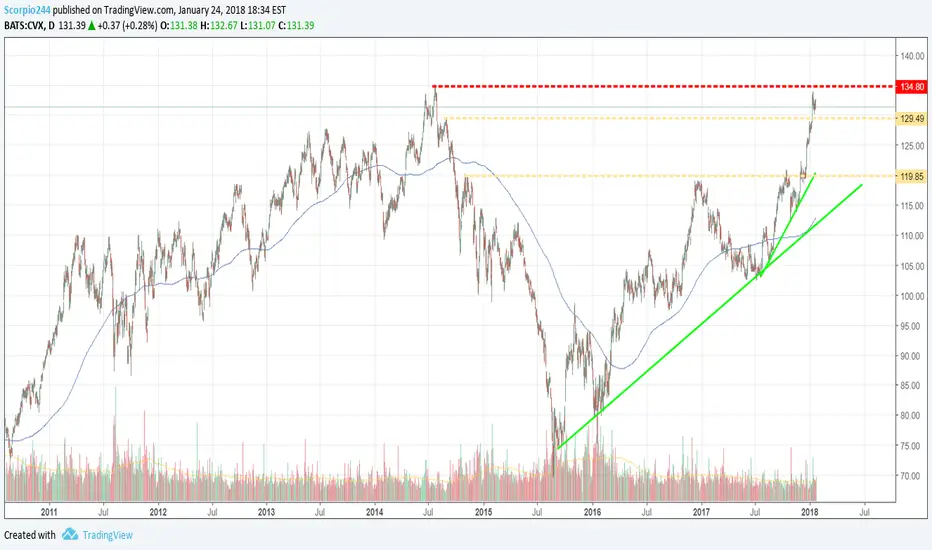
CVX Possible Short Term Pain, But Looking Good Beyond That.Bearish short term ABC correction waves forming with H&S pattern, and possibly bullish mid term reversed H&S pattern forming with a new 12345 wave cycle. Long term seems healthy (possible bullish triangle forming) to break '14 highs.

Chevron, CVX, Bull Put, Credit SpreadI am not licensed or certified by any individual or institution to give financial advice. I am not a professional Stock trader.
Chevron (CVX) gapped down today, big time; but it couldn't break the 100 Day Exponential Moving Average (EMA). If you look back to October 27, 2017 (see the purple arrow I inserted on the lower left of the chart to mark the date) Chevron did the exact same thing. It proceeded to go back up. I think it will repeat itself in the coming days. It used the 100 Day to bounce and will go back up. I typed up the strategy I used for this play and you should be able to see it on the chart. The 200 Day EMA is sitting just above $118.40ish giving this play more than $4.00 of cushion. Additionally, next week is a short trading week in the United States due to markets being closed on Monday in observation of Memorial Day. That means this Stock has four days to not go down more than four dollars, and the Credit from opening the play is kept. Yes, you could tighten the spread; but having the 200 Day EMA adds a little protection, and I'm still learning how to do Spreads. :)


CVX in bearish momentum CVX is in a bearish moment if the resistance proves to be real as the chart indicates

Are the bears coming?A engulfing bearish candlestick pattern around resistance zone, that's shows a double top, can attract some bear power.

Chevron I'd like to go up to 125 - 127 per shareI'm not loving Chevron, but it has potential and I would feel cozy at 125 - 127 per share.
Learn how to beat the market as Professional Trader with an ex-insider!
Have a Good Trading Week,
Cream Live Trading, Best Regards!

Target Price of CVX at April: 126 (125.83-126.23)CVX breaks through the upper resistance line. It is confirmed that CVX is experiencing the 3rd Elliott Wave. With trend of oil pricing surging recently, CVX deserves an updsie in short-mid term (at least), due to its high correlation with oil price.

CVX 10-Day-Ahead Prediction - 04/10-04/19 PeriodArtificial Intelligence/Deep Learning Enabled 10 Day Ahead Predicted values for Chevron Corporation ( CVX ) have been plotted on the chart.
The method used in this prediction is Deep Learning based, and using complex mathematical models/methodologies to extract hidden time series features in vast amounts of CVX related data.
The expected 5 Day Change is 0.822 %
The expected 10 Day Change is 1.409 %
Predictability Indicator is calculated as : 0.675
Predicted 10-Day Ahead Prices are as follows:
Mon Apr 09 Tue Apr 10 Wed Apr 11 Thu Apr 12 Fri Apr 13
115.01 115.20 115.38 115.54 115.70
Mon Apr 16 Tue Apr 17 Wed Apr 18 Thu Apr 19 Fri Apr 20
115.85 115.99 116.12 116.25 116.37
Please note that outliers/non-linearities might occur, however our Artificial Intelligence/Deep Learning Enabled predictions indicate the softened/smoothed moving direction of the stocks/commodities/World indices/ETFs/Foreign Currencies/Cryptocurrencies.
Feel free to contact us for your questions.


Chevron (CVX) Growth Stock Oversold with 7% OpptyChevron has went well into oversold territory as well as the short term EMA is over extended beneath the longer term MA. Previous price action and structure give us a buying opportunity with a modest 7% target.

CVX on the move upChevron is in a large head and shoulders pattern coming out of good earnigns and dividends. six days after dividends CVX starts to climb which perfectly lines up with the head and shoulders forming. Also, MACD has converged today. Price target 117 on or about March 8, possible continuation on up until march 14. Good Luck I entered today long.

Chevron analysisChevron's weekly trend has been up since June of 2015 and it recently breached a strong weekly support only to quickly get back over it. It has a strong weekly support of 102.69 so as long as the week closes above that price the weekly support will remain in effect.
Now Chevron is trading in a small zone between roughly 108-118.
Some long candles formed with a bottom of around 108 which created a short-term support and Friday's move was pretty bullish. I would expect the uptrend to continue when it closes above 117.90 which is currently the short-term resistance.
Earnings were above expectations a few weeks ago and it is currently trading at last years prices with better earnings.
A close under 108 would indicate more sideways movement for unknown duration. I'll keep you posted. 2/25


Why CVX is considered for buying?The considered growth of the Chevron stock price probably won't last long. Need to wait and see, check the additional info.


wave 4 is ended and. ready for fithchevron seems to going up for the fifth wave.it's already broken the deceleration channel.


CVX demand zone long opportunityCVX dropped after its earning report, and it gave a inside day breakout afterward.
At the same time, the oil price rallies a lot that is very close to the important pivot.
Being bullish about oil but not willing to chase the high before the resistance, long a oil company may be an alternative.
Often times, a demand/supply zone is formed by inside bar breakout/breakdown despite the fact that they have totally different trading philosophy.
While if we missed the inside bar breakout to catch the momentum, a pull-back strategy is still better than chase the high.
