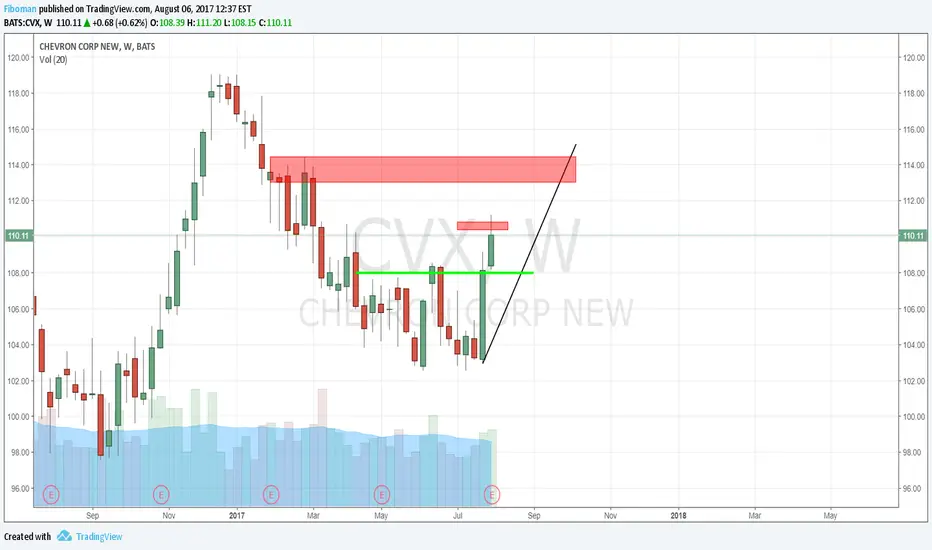
CVX: a life time opportunity is unfoldingNYSE:CVX
note: for all our suggested positions, one should have his own entry strategy. lets make it simple: a trend line (some smart trend line) must be broken before a position is open.
CHV trade ideas


History Says Chevron (CVX) Is Set To Decline At Least 5%Chevron has climbed quick in the previous month. This could be due to hurricanes in the United States and/or OPEC manipulation. No matter the world and economic reasoning, the technicals have a response for this overexuberant movement; the stock will begin dropping soon. The history of this stock has been studied and the information is explained below.
The relative strength index (RSI) is at 80.3974. RSI tends to determine trends, momentum, overbought and oversold levels as well as likelihood of price swings. I personally use anything above 75 as overbought and anything under 25 as oversold. Currently the RSI is at an extreme level that has only occurred 26 times since 1973. The significance of this is outlined below and is the first signal of a pending downturn.
The positive vortex indicator (VI) is at 1.3839 and the negative is at 0.5046. When the positive level is higher than 1 and higher than the negative indicator, the overall price action is moving upward. When the negative level is higher than 1 and higher than the positive indicator, the overall price action is moving downward. The both values are near extremes and this in conjunction with the extreme RSI reading will be covered in the SPECIFIC ANALYSIS section below.
The stochastic oscillator K value is 95.0678 and D value is 83.0602. This is a cyclical oscillator that is highly accurate and can be used to identify overbought/oversold levels as well as pending reversals and short-term activity. I personally use anything above 80 as overbought and below 20 as oversold. When the D value is higher that the K value the stock is trending down. The stochastic is in overbought territory, but it could be another week before the D value is larger than the K value. In order for this crossover to occur, the stock would begin declining. We are looking to short the stock prior to this decline and more is explained below.
SPECIFIC ANALYSIS
I have created an algorithm (called SAG Gauge) which signals when stocks are truly overbought and oversold. The algorithm indicates when a particular stock meets multiple criteria culminating in an oversold or overbought signal. That signal will most likely occur within a few trading days after the stock has begun to move downward. Recognizing this movement and pending signal can increase profit by entering early.
Upon back-testing this indicator, it has signaled overbought status 111 times dating back to 1973. Seventy percent of the time, the stock drops at least 3% over the following 30 trading days after the indicator date. Sixty percent of the time the stock drops at least 5% and fifty percent of the time loses 6.5%. Even though a drop does not always occur, taking the below information into consideration makes us believe we are in that 60% of the time range.
As mentioned above, the RSI alone is at an extreme level that has only occurred 26 individual trading days since 1973. The stock always drops at least 1.58% from the date it reaches the 80.3974 level (which was just achieved on Sept 22) over the following 30 trading days. The median drop over this time frame is 5.71%, average is 6.81% and the maximum drop is 20.35%.
Since 1973, this stock always drops at least 5% when the RSI is at or above its current level, while the positive VI is at or above its current level and the stochastic is in overbought territory. These conditions have only been met four times and the instances were evaluated. The median decline for the stock has been 15.08% over the following 30 trading days. On three of these four occasions, the stock continued to go up for at least 2 more trading days. This additional climb resulted in a minimum stock decline of 6.75%.
Between all of the mentioned historics, I believe the stock could drop at least 5% over the following 40 trading days if not sooner. The best indicator is the simultaneous extremes that have been achieved by the RSI & positive VI. The RSI extreme alone supports this belief & the SAG helps.


Chevron Buy IdeaD1 - Bullish Convergence
H1/H4 - Looking for two waves down, Trend line breakout for entries
Invalidation - If price breaks below 102.40


Long CVX!!Hello all
Let's take a look at CVX.
Monthly: HA doji . Still at resistance as you can see. Mac-d is neutral as of now. Chikou attempting to come out of price.
Weekly: Macd is crossed up. Chikou below price and price at kijun.
Daily: Price breaking 6 month of downtrend .Bullish ichimoku.
Looking to buy dip as earnings are out of the way now.
Thanks for the read.
Cheers


CVX - a Short Signal from CPT Trading SystemThis weekend a short signal from CPT on the weekly timeframe, but - where is a 50 / 50 chance for going long opportunity because market is random. Do you agree?

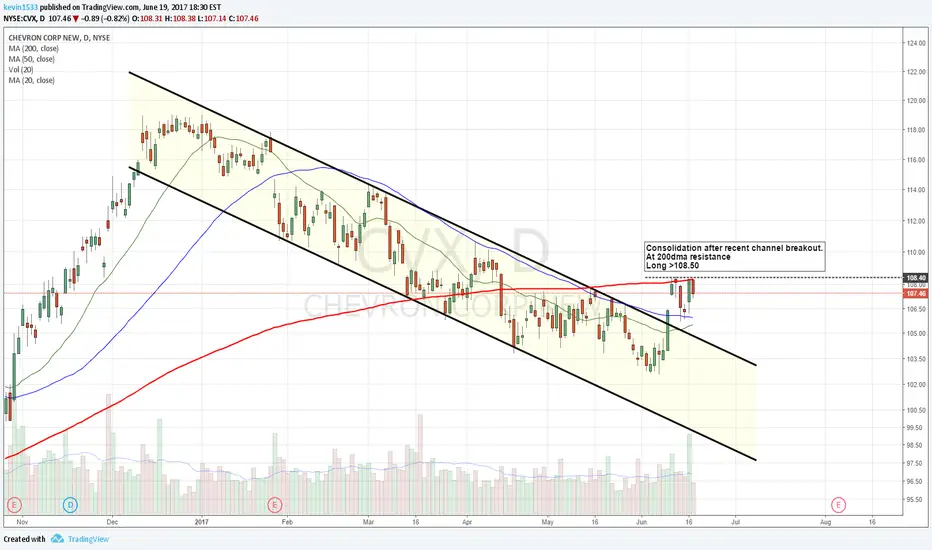
CVX - Downward channel breakout Momentum long from $108.50 CVX is another Downward channel breakout Long potential. It has broken out the channel & looking very strong. Moneyflow is very up. We think it has good upside potential.
* Trade Criteria *
Date First Found- June 19, 2017
Pattern/Why- Downward channel breakout
Entry Target Criteria- Break of $108.50
Exit Target Criteria-Momentum, $114
Stop Loss Criteria- $104.73
Please check back for Trade updates. (Note: Trade update is little delayed here.)


Earnings trade on ChevronBought the 106/107 Call Debit spread and sold the 104 Put to financed it (1 day to expire). Max profit is $108. Our break even is at 103.92

Chevron Good level to buy?Well ,it all depends on the oil prices. But from what I see here it looks like an attractive buy level, as prices are finding support at around 107.5$ which coincide with the 200 EMA level. Next targets 109.70$, 114.30$, than the old high of 119$. A break below 107.50$, will lead to 104.30$ and invalidate the scenario.
