CHV trade ideas

CVX Bull Put Spread and or sell putsCVX has made a strong bullish moved from it low about 102.36 close on 1/30/14 There has been a strong gap and is trading above 10 20 and 50 EMA , and just closed above the 100 SMA. The gap at 107.37 should offer a strong support for a BPS 107/106 EXp 2/27 for .11 or 3/6 for .16.
Should your want to own the shares a 101 put sale will bring in .65 approx.

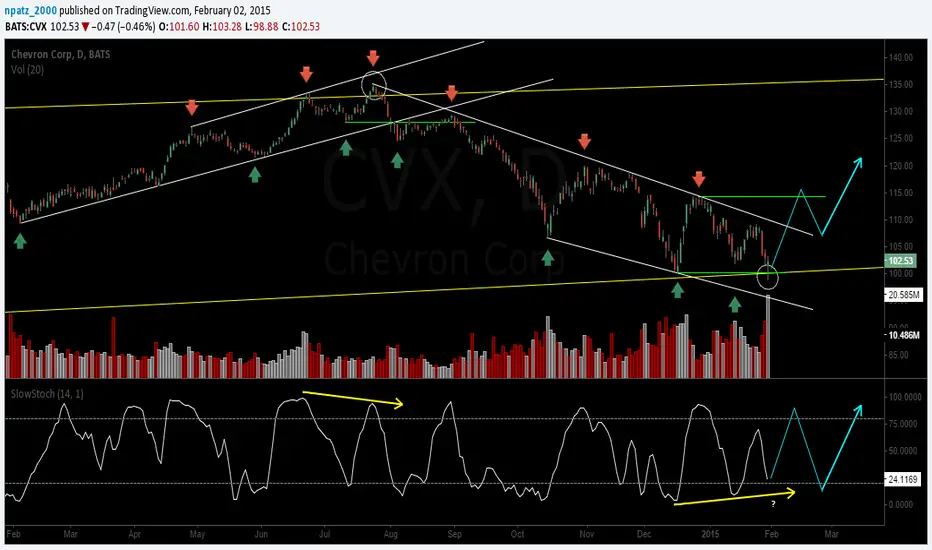
POTENTIAL LONG ON CVXDouble bottom with confluence of a potential long term bull trendline; reversal candle on increased volume; stochastic divergence; downward channel into a potential broader bullish channel.
Not an entry yet, simply a possible bottom, need to see a bullish move (jump the creek - Wyckoff), then a small retracement (back up to the creek - Wyckoff) with another reversal candle pattern for entry back up to the top of the channel. This current bar could be a "spring" (AKA Terminal Shakeout - Wyckoff).
CVX Not Looking So Hot...Monthly candle chart...
The bearish Moving Average Cross (9 month, 21 month) is by far the most concerning due to the fact that it has so accurately marked the early stages of large downtrends.
This stock has an unhealthy love for everything fibonacci....retracements, extensions, you name it... (some shown).
What appears to be the 4th month after the monthly PSAR flipped to "bearish" looks to be only the beginning.
CVX cracked the 200 week simple moving average support (not shown), which is never a good thing.
The drop in crude oil prices have hurt the industry and therefore CVX.
Not that it will do much good for quite a while, but I am thinking that the bottom of this decline will be in the mid-80's, at which point this becomes an excellent buy.
The only thing that I see as bullish is the respectable dividend, although it is not so high that it will prevent further decline.
...wait and enter in the 80's OR short sell if you choose.

Binary Event - Bullish moveCVX is a correlative equity to XOM. These are consist in trend moves comparable to other equities in their sector. You want volatility for the option's play. Right now, CVX is at a crossroads with an IV of 73 and HV 71. With earnings coming up, we're expecting a shift north till the end of this year's first quarter. That's a good play to go deep in options. FEB (22) Call Strike 105 is our target for front month. APR 15 (78) Call Strike is 110 and/or 115. The decrease in IV over the next months in consideration of the options months shows favorable signs of going north. Tomorrow is we'll know.

CVX, $100 buy at earningsCVX Bearish pennant seems to be holding.
Moving into earnings now. CVX is in a weakened position, will of course oil, slumping...but also strong dollar exposure. CVX has a bunch of big gas projects overseas (Australia) and the strong dollar, weak gas, and high execution cost overseas may just be the drag to break it to the down side.
Volume is nice here...strong buyers at the bottom of the wedge, no one wants it at the top of the wedge.
Should crash down to $100 at earnings and get support with strong dividend buyers
***Overall***
If you love the long term $100 is a great place to buy.

CVX Short ~ 8 to 1 risk rewardAB = CD measured move price target of $98 . Short entry at $106.65 at the B swing point with a $1 stop. 8 to 1 risk reward.

CVX - longer term entry maybe. Closed below the 200 SMA on the weekly.
Bearish retest Gap. Dan Walsh is looking for a longer term entry and trade.
IF CVX closes above 112, I would be more bullish than bearish for the short term. If CVX breaks the 108 low, could buy protective puts.

Chevron - CVX - Daily - Anatomy of the recent TRENDSHere is the method that I look for trade setups:
Look for RgMov to reach a 2 month high and then buy dips to oversold in 11-day CCI.
Look and see where the quarterly "key hidden levels" are for support or resistance.
Buy only if the stock climbs above the lowest high in the dip. Exit when CCI reaches +100 or falls under a previous day's low.
On shorts, sell only when it drops under the highest low of a rally. Cover when CCI reaches -100 or climbs over a previous day's high.
CVX has been a money machine with all but 1 losing trade giving it a batting average of more than 800. (5 out of 6)
Tim 11:12AM EST 9/25/2014 Thursday


Chevron Corp -CVX -Daily -Reshorting here on the bounceFollowing the previous trade-plan to sell on a bounce.
The CCI is lifting just like the rally in January. A reading of "0" in CCI would be fine if it CVX heads up again tomorrow.
The downside is to 119 target for this next swing trade down.
Tim 4:15PM EST 124.96 last

Chevron Corp -CVX -Dailiy - Oversold in a Major DowntrendNote the current decline and compare it to the decline in January-February.
The current oversold level will relieve itself with a small rally and a new down wave can commence.
114 target by year-end. 122.89 last.
*** Key Hidden Levels are a subscription service available at "MarketPlace Add-Ons"
Tim

CVX - hourly forming double bottom, on daily and weekly supportDivergence
Status: Long
Cost basis: $123
Stop:
First price target: 126
Technical:
Horizontal S&R: no
Trend line S&R: yes, 3 lines
Channel S&R: yes
MA S&R: yes, 200
Pearson's R >= 85: yes, but early
Price @ MOB or Fib Ext >1.38<1.62:
AO divergence: yes
Fundamentals:
Next Earnings date: 10/30
IBD EPS Rating: 54
IBD SMR Rating: C

CVX Triple supportPullback
Status: Long
Cost basis: 122.83
Stop:
First price target: 125
Technicals:
Trend line S&R: yes
Channel S&R: early
MA S&R: yes
Pearson's R >= 85: early
Price within Fib Ret..62: yes
Stochastic turn/crossover above 80%: no. too early
AO pullback >0<1.38: could be forming divergence
Fundamentals:
Next Earnings date: 10/30
IBD EPS Rating: 54
IBD SMR Rating: C

Chevron Corp - CVX - Daily - Turning down from key resistanceKey Hidden Levels are working well in CVX to show the various reaction points well in advance.
Subscribe at "Indicators" -> "Marketplace Add-Ons" -> "Key Hidden Levels" for a low monthly fee.
Tim
3:23PM EST 9/2/2014

CVX Long EntryBullish momentum divergence occurring at a major support level for CVX which also happens to be hitting the 100 SMA. A couple of candles of indecision make it look like CVX could be prime for a climb to its newly formed resistance level.

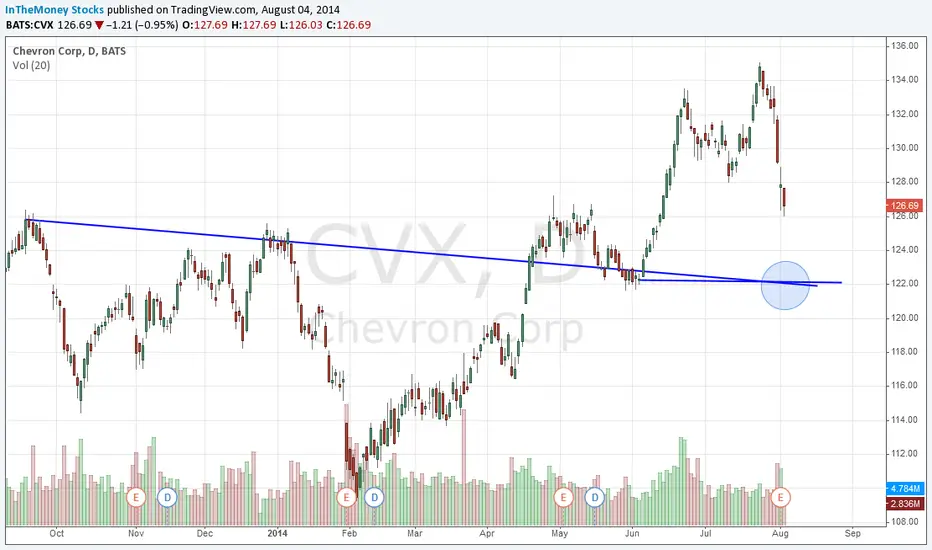
Chevron Corporation Collapses Off Highs: Buy It HereChevron Corporation (NYSE:CVX) has dropped sharply over the last week. The stock just made a new all-time highs prior, and is seeing profit taking. Chevron Corp will hit support at $122.00. This is a culmination of support trend lines as well as the 200 daily moving average. A significant bounce should occur if this level is hit in the next week. Chevron can be taken as a swing trade.
Gareth Soloway
Chief Market Strategist
www.InTheMoneyStocks.com


Chevron Projected to Rise Around 8%, Classic Elliott 5-Wave1) Price has been trading within an Uptrend Channel, since Sep 2012
2) Price was resisted against 128.00 from 2013 to 2014, with an attempt to break the Channel Trendline on 2014-01-30. However this turns out to be a false break, with price trading back into the Uptrend Channel
3) We note a classic Elliott Wave developing, from 2014-04-14 to 2014-07-15, with a 2 clear impulse waves and 2 corrective waves.
Given the cluster of Support buying at 128.00 levels, it is projected that Price is ready to breakout above 132.00 and trade higher, forming the next impulse wave.
Theoretical Price Projection:
a) 139.76 (Assumption: Wave III = Wave V)
b) 147.02
Upper Channel Limitation: Any upward move will most likely be bounded by the Upper Channel Line
Time Limitation: The projected strong upward price movement should happen within 12 Trading Days, after price closes above 132.00

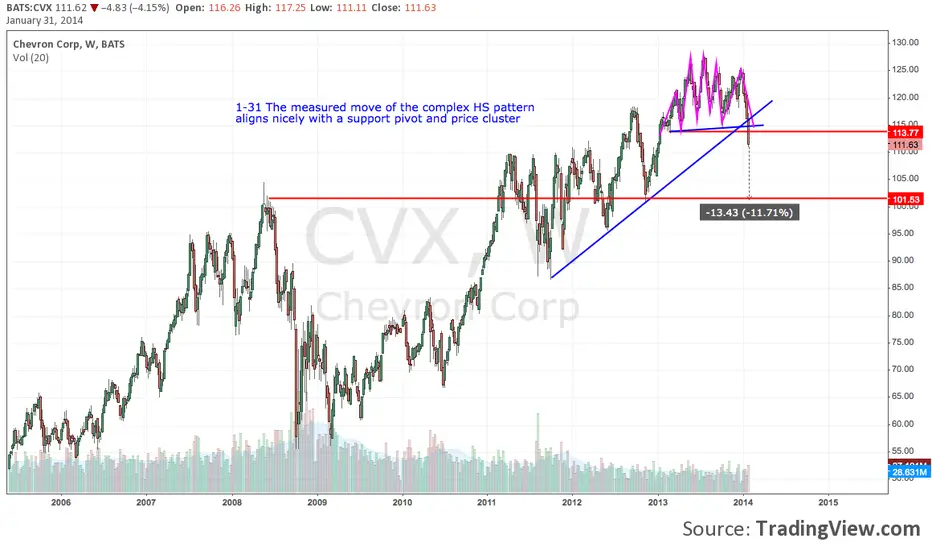
chevron breaking out of a 3 year 3 month consildation rangeOn 5/19/2008 chevron put in a key swing high ( resistance level) at 104.63. Shortly after the swing high Chevron Sold off and found support. After the bounce of support the market got very choppy and on the close of the weekly candle stick of 10/18/2010. Price of the close of the candle stick was 84.55. Then market started to break out to reach the swing high of 104.63.
Now I want to quickly point out that it took from 10/18/2010-3/21/11 which is a little over four months for the market to reach the swing high. That range of 84.55 to 104.63 is 20.08 cents.
After the market reached the 104.63 price level on 3/21/11, it took until 5/20/13 for chevron to go up another 20.08.
Also not that it has stayed in a 23 dollar range for the time period between 3/21/11 to 6/9/14 ( depending if this week candle stick closes above 127.91) That range lasted 3 years and almost 3 months of consolidation.
If the market can close above the 127.91 support level, look for the market to either pull back and bounce off of the 127.91 support level or the market may have enough momentum to not see a pull back and shoot up 20 dollars.