CSCO intuition/earnings idea Target $60-62Last week in one of those rare moments I attempt to meditate, I was doing my little mental countdown and was totally interrupted in my head by: "CSCO, CSCO, CSCO"
I figured it was for earnings, which are tonight. I did a dowsing reading on it and it was really bullish.
I get a move of 20% ($60.21) from current price $50.18, but this morning the price target was the number 62. Let's see if it makes a total fool out of me!
CIS trade ideas

Cisco Systems Analysis Weekly Cisco Systems Inc., commonly known as Cisco, is a U.S. multinational company that specializes in the supply of networking equipment.

Neutral - Watching Pennant/Triangle Consolidation PatternCisco is having trouble getting past the high from the tech bubble at the turn of the century. Keeping an eye on this chart pattern that has formed as it consolidates (may take several more years to play out). I won't short if it breaks down, but I'm watching for a potential upward breakout to trade on (looking for a decisive monthly close above the green tend line ideally with significant volume).

Cisco Set To Cut More Than 4,000 JobsCisco Systems ( NASDAQ:CSCO ), a stalwart in the networking equipment industry, has announced significant job cuts and a revised downward revenue forecast. The decision, unveiled in the wake of a tough economy that has seen a slew of layoffs within the tech sector, underscores the company's proactive stance in adapting to market realities.
The Silicon Valley giant revealed plans to trim its workforce by 5%, translating to over 4,000 job losses globally. This sobering announcement sent ripples through the financial markets, with Cisco's ( NASDAQ:CSCO ) stock dipping over 5% in extended trading. The company revised its annual revenue target to a range of $51.5 billion to $52.5 billion, down from its initial projection of $53.8 billion to $55 billion, citing persistent challenges in the telecom sector and weakened demand from telco and cable service providers.
CEO Charles Robbins, addressing analysts during a conference call, acknowledged the prevailing headwinds but remained resolute in the face of adversity. He emphasized Cisco's strategic realignment towards high-growth areas, particularly in the realm of artificial intelligence (AI). The company's partnership with industry titan Nvidia signals a concerted effort to leverage cutting-edge technology and capitalize on burgeoning opportunities in data centers and AI applications.
Despite the near-term turbulence, analysts anticipate a gradual recovery, with the networking hardware inventory overhang expected to dissipate by the latter half of 2024 or early 2025. Joe Brunetto, an analyst at Third Bridge, noted the industry-wide trend of clients prioritizing the clearance of excess networking gear inventory, setting the stage for a potential resurgence in demand.
Looking ahead, Cisco ( NASDAQ:CSCO ) remains steadfast in its commitment to innovation and adaptation. The company's third-quarter revenue projection, albeit below analyst estimates, reflects a pragmatic outlook amidst evolving market dynamics. With a workforce of 85,000 employees, Cisco ( NASDAQ:CSCO ) aims to navigate the restructuring process judiciously, mitigating the impact on its workforce while optimizing operational efficiency.
The forthcoming layoffs are projected to incur a substantial charge of $800 million before tax, primarily attributable to severance and associated costs. However, Cisco ( NASDAQ:CSCO ) anticipates recognizing the majority of these charges in the first half of fiscal 2025, signaling a concerted effort to expedite the transition and position the company for sustained growth.
In the second quarter, Cisco( NASDAQ:CSCO ) showcased resilience, surpassing analyst expectations with an adjusted profit of 87 cents per share and revenue of $12.79 billion. This robust performance underscores the company's underlying strength and resilience amidst a challenging economic backdrop.
As Cisco ( NASDAQ:CSCO ) navigates the uncertainties of the current landscape, its strategic focus on AI and innovation remains unwavering. The partnership with Nvidia exemplifies a forward-thinking approach, harnessing synergies to drive growth and unlock new avenues of opportunity. Amidst the prevailing challenges, Cisco's proactive measures underscore a commitment to resilience, innovation, and long-term value creation in an ever-evolving market landscape.

CSCO Cisco Systems Options Ahead of EarningsIf you haven`t bought the dip on CSCO:
Then analyzing the options chain and the chart patterns of CSCO Cisco Systems prior to the earnings report this week,
I would consider purchasing the 52.50usd strike price Calls with
an expiration date of 2024-6-21,
for a premium of approximately $1.86.
If these options prove to be profitable prior to the earnings release, I would sell at least half of them.

CISCO Stock Chart Fibonacci Analysis 021024 Trading Idea
1) Find a FIBO slingshot
2) Check FIBO 61.80% level
3) Entry Point > 51/61.80%
Chart time frame : D
A) 15 min(1W-3M)
B) 1 hr(3M-6M)
C) 4 hr(6M-1year)
D) 1 day(1-3years)
Stock progress : B
A) Keep rising over 61.80% resistance
B) 61.80% resistance
C) Hit the bottom
D) Hit the top
Stocks rise as they rise from support and fall from resistance. Our goal is to find a low support point and enter. It can be referred to as buying at the pullback point. The pullback point can be found with a Fibonacci extension of 61.80%. This is a step to find entry level. 1) Find a triangle (Fibonacci Speed Fan Line) that connects the high (resistance) and low (support) points of the stock in progress, where it is continuously expressed as a Slingshot, 2) and create a Fibonacci extension level for the first rising wave from the start point of slingshot pattern.
When the current price goes over 61.80% level , that can be a good entry point, especially if the SMA 100 and 200 curves are gathered together at 61.80%, it is a very good entry point.
As a great help, tradingview provide these Fibonacci speed fan lines and extension levels with ease. So if you use the Fibonacci fan line, the extension level, and the SMA 100/200 curve well, you can find an entry point for the stock market. At least you have to enter at this low point to avoid trading failure, and if you are skilled at entering this low point, with fibonacci6180 technique, your reading skill to chart will be greatly improved.
If you want to do day trading, please set the time frame to 5 minutes or 15 minutes, and you will see many of the low point of rising stocks.
If want to prefer long term range trading, you can set the time frame to 1 hr or 1 day.

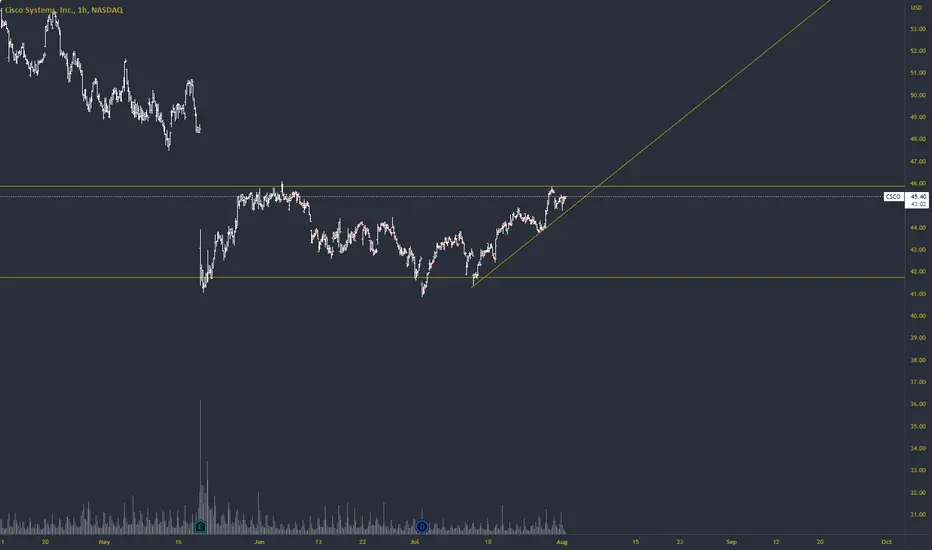
CSCO Support ZoneThe trend is upward since November and has been corrected in January already. After the little attempt yesterday and the renewed rise today I assume that we can continue to rise.
We are still within a Fibonacci based support/resistance zone. Its bottom is the October low and the top the present January high. May be it will take some time to get decisively above this zone. But if we maintain the momentum it may go up then quickly.

CISCO Strong Bullish Break-outCisco Systems (CSCO) is sustainably breaking above the Lower Highs trend-line that started on the September 01 2023 High, which was a Higher High on the 1.5 year Channel Up pattern. This break-out has turned the 1D MA50 (blue trend-line) into a Support and the only barrier that remains before a new bullish wave is the 1D MA200 (orange trend-line).
If broken (1D candle closing above it), we will target Resistance 1 at 53.50. Notice how based on the 1D MACD symmetry we are on the exact same consolidation levels (blue ellipse) before which a strong rally followed.
-------------------------------------------------------------------------------
** Please LIKE 👍, FOLLOW ✅, SHARE 🙌 and COMMENT ✍ if you enjoy this idea! Also share your ideas and charts in the comments section below! This is best way to keep it relevant, support us, keep the content here free and allow the idea to reach as many people as possible. **
-------------------------------------------------------------------------------
💸💸💸💸💸💸
👇 👇 👇 👇 👇 👇

Trend Line or Resistance, Which one will it be?Solid trend line formed at resistance on CSCO. Long if there's a breakout here.
CISO Global's Battle Against Delisting & the Path to Redemption
Cybersecurity and compliance company CISO Global (NASDAQ: NASDAQ:CISO ) finds itself facing a daunting challenge – the looming threat of delisting from the Nasdaq Exchange. With the stock currently down 14%, investors are anxiously watching the company's every move, hoping for a strategic plan that could reverse its fortunes.
The Delisting Conundrum:
The catalyst behind CISO Global's recent stock plunge lies in an updated delisting notice from the Nasdaq Exchange. The primary issue stems from the company's shares consistently trading below the critical threshold of 10 cents. While CISO had been grappling with the minimum $1 bid requirement since March 2023, a new hurdle emerged as the stock closed 10 consecutive trading days below the 10-cent mark, triggering an additional delisting warning.
The company had until March 2024 to regain compliance with the Nasdaq's minimum bid price rule, a deadline that now seems increasingly challenging to meet. In response to the latest notice, CISO Global has expressed its intention to appeal the Nasdaq Exchange's decision, striving to present a compelling plan to lift its stock price above the $1 minimum bid.
Investor Sentiment and Market Impact:
Unsurprisingly, the barrage of delisting warnings has sent shockwaves through the CISO shareholder community. With the stock already under pressure due to its low trading price, the added uncertainty regarding its Nasdaq status has further dampened investor morale. The 13.9% drop in CISO stock on Friday reflects the growing concerns and skepticism among investors about the company's ability to overcome this formidable challenge.
Path to Redemption:
Amidst the gloomy outlook, CISO Global remains resolute in its determination to fight the delisting decision. The company is now tasked with crafting a strategic plan that not only convinces the Nasdaq Exchange to grant an appeal but also outlines a viable path to elevate its share price above the required threshold. Investors are eagerly awaiting details of this plan, as it holds the key to the company's redemption and continued presence on the Nasdaq.
Conclusion:
CISO Global's battle against delisting serves as a stark reminder of the volatile nature of the stock market and the challenges faced by companies struggling to meet stringent listing requirements. As the cybersecurity and compliance sector continues to evolve rapidly, CISO Global's fate on the Nasdaq will undoubtedly influence investor sentiment and market dynamics. The coming weeks will be crucial as the company unveils its strategy to navigate these turbulent waters and regain the trust of shareholders and stakeholders alike.

Cisco Wins Centripetal Patent Case that Led to $2.75 Bln awardA federal judge in Virginia has rejected cybersecurity company Centripetal Networks' patent infringement claims against Cisco Systems (CSCO.O) in a multi-billion-dollar fight over network-security technology.
A different judge in the same court, U.S. District Judge Henry Morgan, had awarded Centripetal $2.75 billion in the case in 2020, marking the largest patent damages award in U.S. history. A federal appeals court later overturned that award on ethics grounds because Morgan's wife owned Cisco stock.
Morgan had died in the interim, and the appeals court directed that the case be heard by a new judge. U.S. District Judge Elizabeth Hanes held new hearings in the case and ruled on Monday that Cisco did not infringe the patents.
Reston, Virginia-based Centripetal sued Cisco in 2018, claiming Cisco's routers, network-security software and other products infringed patents related to Centripetal's technology for blocking security threats from entering a computer network.
Morgan ruled for Centripetal in 2020 after a non-jury trial. He awarded Centripetal $1.9 billion in damages, plus royalties that Cisco said increased the total to more than $2.7 billion.
Morgan told the companies before issuing his ruling that he had learned his wife owned 100 shares of Cisco stock worth $4,688. He said that he was unaware of the stock during the trial and that it had not influenced his handling of the case.

Long CSCO Cyber Monday SaleNASDAQ:CSCO has been doing well in the last couple of years. They've been managing their debt really well.

Mid to low 30s monthly target for CSCOThe bearish case here can not be ignored, especially if buyers fail to see value in higher prices in the 45 zone. Next zone to watch would be the .786 retracement around the 42 zone and below that we should anticipate the extension targets in the mid to low 30s.

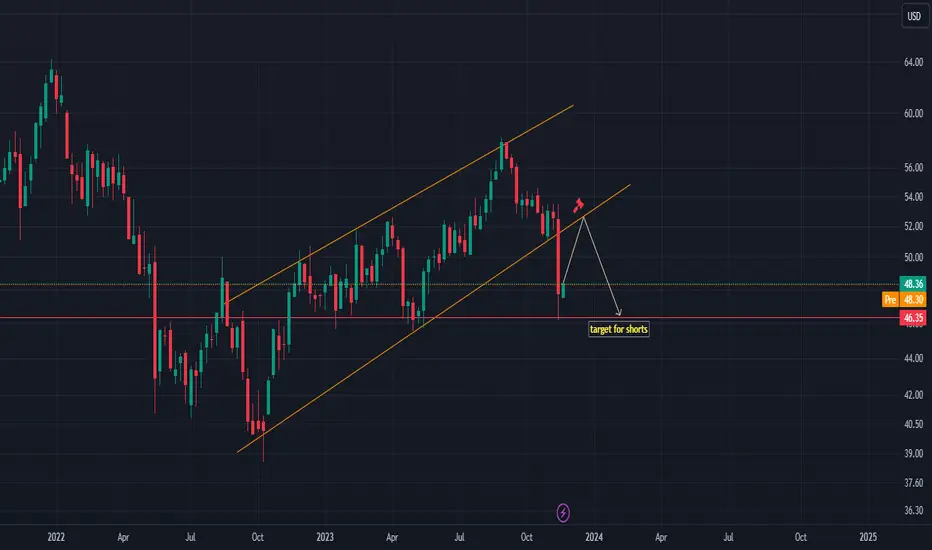
CSCO - bearish retest likelyhi traders
Let's have a look at CSCO on the weekly time frame.
CSCO look bearish but a short-term bounce and the bearish retest is pretty likely now.
If we get a bounce towards the previous upsloping support which should be acting as a resistance now, it may be a great opportunity to enter short position.
Target for shorts: 46.35
Do you agree?

Good time to buy CSCO, but need to be cautious since VIX is ...It's a very good time to buy CSCO, but need to be cautious since VIX is near the bottom - it means a bear move is coming soon. Also, we opened a short position on TGT.
After earnings, CSCO fell sharply downwards and the Bearish Greed indicator shows that CSCO is in the green buy zone, which creates good momentum.

CSCO - BEARISH SCENARIOCisco revised its yearly projections despite exceeding expectations in its fiscal first quarter, with a 9% stock decline afterward. The company reported adjusted EPS of $1.11 on $14.7 billion revenue, beating analyst predictions. Q2 projections are $0.82 to $0.84 EPS on $12.6B to $12.8B revenue, differing from estimates. Cisco adjusted its 2024 guidance to $3.87 to $3.93 EPS on $53.8B to $55.0B revenue, down from prior estimates. It anticipates a demand uptick in the latter half of the year after customers deploy recent products. Cisco remains committed to efficiency and shareholder returns.
Risk Disclosure: Trading Foreign Exchange (Forex) and Contracts of Difference (CFD's) carries a high level of risk. By registering and signing up, any client affirms their understanding of their own personal accountability for all transactions performed within their account and recognizes the risks associated with trading on such markets and on such sites. Furthermore, one understands that the company carries zero influence over transactions, markets, and trading signals, therefore, cannot be held liable nor guarantee any profits or losses.

CISCO set for market volatilityCisco Traders Prepare for Earnings Results Today; EPS of 1.03 Expected
Cisco (CSCO) is a global networking infrastructure manufacturer. The company is set to open today's session at 53.37 after closing yesterday at 53.17, gaining 94 cents (1.8%).
Cisco traded 112% more shares than its average daily volume of 16.20 million shares.
Cisco's Recent Performance and Market Cap
Cisco has gained 2% in the previous 5 days.
It has outperformed the Nasdaq by 26.14% so far this year in terms of returns.
Cisco currently has a market cap of $215.37 billion.
Technical Outlook
Cisco bulls are looking to push the stock past a key resistance level at 53.54 as the next upside milestone if they maintain their dominance. In the short term, a break above this level could open up a new path for further gains towards 53.90 and 54.80. Cisco is also approaching a significant Bollinger Band® level at 53.75, which adds to the bullish sentiment building around the stock.
The uptrend for Cisco has seen its share price rise 2.25% over the past four days, and it is expected to continue with a further 94 cents, or a 1.8% rise today.
Analyst Opinion
Despite its strong performance in the current session, Cisco remains rated as a "Strong Sell" by analysts. However, the stock has outperformed the Nasdaq by 26.14% this year

Bad Times Ahead for CSCOWeekly Charts of CSCO
A-B-C Corrective Wave formation after 1-2-3-4-5 Motive Wave is complete. The Corrective Wave reached 78.6 percent retracement of the Motive Wave.
After completion of the Corrective Wave, CSCO made a large gap down on 21 September. Subsequently, it made two unsuccessful efforts to fill the gap.
CSCO is now testing a resistance level and will go down further for several weeks, if not more.

CISCO SYSTEMS TO 38USDHello,
CITI bank has put a target for CISCO to hit 45 from a fundamental point of view, I agree with the same but my target is USD 38 for this stock from a technical point of view.
Good luck

"Cisco's Earnings Report: NASDAQ Watch"Cisco's NASDAQ Surge: A Bullish Day
Cisco (CSCO) is witnessing a bullish trend today on the NASDAQ. The stock's robust performance is attributed to an impressive earnings report, which exceeded expectations. With a surge in demand for networking and cybersecurity solutions, Cisco's revenue and profitability have soared. Technical indicators, including the Relative Strength Index (RSI) and Simple Moving Averages (SMA), confirm the bullish sentiment, showing strong buying momentum and positive trends. As businesses increasingly rely on digital infrastructure, Cisco's position in the tech sector appears sturdy, making it a stock to watch for those seeking opportunities in today's market.

CSCO Short - B wave formingWatch CSCO as it continues to drop on the B wave. Look for a target of $50.50. Consider buying options 2 Fridays out one this is confirmed.

Buy limits using fibonaccithis stock seems to be cyclical, therefore could be considered for swing style trades.
based on fibonacci, and assuming ownership of some stock, this suggests Sell limit orders to set and forget.
