Dillard's (NYSE: DDS) Stock Surges 16% in a WeekDillard's Inc. (NYSE: NYSE:DDS) shares have surged by 16% over the past week, propelled by the company's impressive return on equity (ROE) of 43%, which significantly outstrips the industry average of 17%. The American department store chain has demonstrated considerable financial strength with a net profit of $777 million and shareholders' equity of $1.8 billion.
The retailer's financial performance shines with a five-year net income growth rate of 45%, eclipsing the industry's average growth rate of 14%. This robust growth trajectory is further underscored by Dillard's consistent dividend payouts, which reflect a tradition of sharing profits with its investors for over a decade. The company has maintained a conservative three-year median payout ratio at just 1.6%, indicating a strategic focus on reinvesting earnings to fuel business expansion.
Despite these strong financial metrics, analysts are forecasting a potential slowdown in Dillard's earnings growth. Investors and market watchers looking to gauge the retailer's future performance and intrinsic value are encouraged to consult available infographics and analyst predictions that outline these expectations. These resources provide insights into the factors that may influence Dillard's earnings trajectory in the coming periods.
Price Momentum
DDS is trading in the middle of its 52-week range and above its 200-day simple moving average.
What does this mean?
Investors are still evaluating the share price, but the stock still appears to have some upward momentum. This is a positive sign for the stock's future value.
DL7A trade ideas

$DDS between rock and a hard placeDDS has gone from being $20 stock during COVID crash to reaching $400 in 2 years, 20 bagger. A freaking Dirt Mall! WoW!
20 bagger! They've made such great profits in the past couple of years but I believe, eventually free money will run out and people will shop less.
From the technical standpoint we can see H&S very close to being complete indicating possible price collapse. However, if you look closely you'll see small bull flag in recent price action that could result in the upside. What's going for DDS right now is they're still riding the peak of consumer spending but there's no more room to grow there. Their share repurchase program has been going strong but I think ultimately, they used up that extra cash to buy back at premium.
Will they reward the shareholders with that nice December dividend like they've done in the past?
It's a weird stock that could go either way. If you're convinced there will be recession go Short. If you think unemployment will keep at record low you might as well go long here.
There will be many winners and as many losers in here. Gamble away.

Shark/WPrice appears to have completed a W pattern, a Shark that ended at the .886 of 0X.
Valley 2 is lower than valley 1.
Possible M forming which could take this down a notch or 2. Possibly a Bat.
No recommendation.
Short interest is around 18%.
No recommendation

Shark//W PatternIf price does not go higher, this looks like a Shark which ends at the .886 Fib level.
It would be called a Bearish Shark as leg 4 is an UPWARD leg and it looks like a crooked W with valley 2 being lower than valley 1.
I left the 4th leg dashed in case it is not complete.
If the 4th leg were to reach the 1.113 this would be an alternate Shark.
A Shark is labeled 0XABC. There is also the bullish version which appears as a crooked M on a chart.
Bearish Engulfing candle so far today but needs a third candle for confirmation. If so, the candle pattern would be a 3 outside down.
No recommendation/Short interest is over 19%.
52 Week Range
184.14
417.86
Day Range
332.20
348.11
EPS (FWD)
36.76
PE (FWD)
9.40
Div Rate (FWD)
$0.80
Yield (FWD)
0.23%
Short Interest
19.51%
Market Cap
$5.70B
Volume
38,936

Descending TrianglePrice has broken upward from the triangle.
Short interest is always high on DDS and is around 17% right now.
Earnings 2-21 AMC
Possibly a bit overvalued here.
No recommendation.
Volatile as a volcano )o:
When this finally chills, it may be a good short.

How Much is Dillards Worth?Holy Moly!!!
I suppose the worth of this stock is yet to be determined.
I am pretty sure DDS beat earnings but I also know short interest is very high on this one and this high short interest could be driving the price up.
Flag noted. This pattern is neutral until broken.
No recommendation.

Cup and HandleEarnings beat yesterday. I think Dillard' beat by quite a bit.
Short percent is high on DDS at around 16% and could explain the high gains on this stock due to short covering. 6% of the group have covered their short at this point so there are plenty more who remain short.
Price has been in a large horizontal trading channel for quite some time.
The cup formed within this channel.
Price is just over the resistance line of the Rectangle and I turned it blue. Blue meaning it is not quite resistance anymore but not quite a support level yet either.
(Green to me is a strong support level. Red is a strong resistance level and orange is a weaker or possible new resistance level).
Targets in green above the cup are possible targets long.
Orange type below rectangle are possible targets if rectangle breaks to the downside.
A lot depends on this latest rally to the upside so be safe.
Shorties are usually pretty good at this kind of stuff and it seems as a rule short interest is high when the stock has fundamentals that are weak.
I need to figure out what the deal is with DDS and why short is so high. If you know, let Me know (o:
No recommendation

Short idea #17- Home run swing?This is one of the most peculiar stocks on my watchlist. It is very high up and has a history rich with pumps & dumps. I anticipate this stock will *eventually* dump, but forecasting this one is very difficult. I am likely going to short this name when $SPY reaches 389 as it hovers at resistance, but I would be very careful playing this name- I am likely going to play it with very small size to test waters; one thing I would contribute is that if I owned stock in this name, I would be selling all of it right now. This stock has a lot of room to fall, the question is when & how does it do so.

Symmetrical Triangle/RectangleNeutral pattern until a trendline is broken.
Price is a large rectangle with patterns inside the rectangle.
Green spinning top at this moment representing indecision.
Also the last 3 candles are exhibiting a candle pattern known as Deliberation. Candle 1 is a large green candle, candle 2 is smaller and candle 3 is even smaller. This can indicate a decrease in the momentum of the recent trend.
EPS (FWD)
36.23
PE (FWD)
7.87
Div Rate (FWD)
$0.80
Yield (FWD)
0.28%
Short Interest
18.13%
Market Cap
$4.67B
No recommendation

Rectangle/Triple TopThe impulse wave of this security looks a bit like an Arc as it is an extremely steep climb.
Very wide rectangle with a triple top at the resistance level.
Looks like a Bat is forming but too soon to tell.
There is a gap below price. Price could sail right through it or it may provide temporary support.
If one were to enter this short, a break in to that gap may be a good short entry level.
Short interest is around 17.4%, so IT IS on the high side.
Analysts appear very bullish on DDS. Analysts are lagging indicators and I try not to buy or sell based on analyst's upgrades or downgrades.
No recommendation.
If this is a Bat the .886 is at 210is and the 1.113 is at 176ish. The .886 is at the 50% retracement level so there is confluence.
Weekly chart

Wizard Setup. Target 441DDS is more volatile than GME, TSLA, any name you can think of. Here is an opportunity to leverage this volatility for massive gains in a short time period:
- just broke out and has another gap to fill above at 370
- the DMI suggests major accumulation following the pullback from all time high and the indicator "ADX Breakout" calculates the target based on DMI dynamics and previous average range over a period. Target is 441, stop loss 275
- stochastic RSI is identical to right before last pop at the end of 2021 and this pattern is characteristic of a short squeeze (and there is indication shorts have already started to cover); short data posted below:
short percent float: 15.21%
short interest ratio (days to cover): 6.2
short% increase/decrease: -13%
I like the June 17 370 calls and the July 15 390 calls. Not financial advice.
Best,
Tommy (rewards member)

DDS: BREAKOUT, POTENTIAL 16% MOVEDDS , Dillard's (Department stores).
I like the break of that 292 resistance (the flat of the ICHIMOKU cloud). Just got long for a swing trade.
My first target is 319, which is the flat line of the upper cloud.
My second target is around 339, to close the gap of November 2021.
My stop is under today's candle, around 290.
Trade safe.

US Stock In Play: $DDS$DDS held onto $225 support on 3 occasion during the market correction in dec and jan, forming a very constructive cup and handle formation.
now trading above 10/20/50MA this week, but still have a ATH VWAP at $278 to recapture. that will be the cleanest breakout level imho.

DDS Consolidating finding SupportDDS is showing that it has stopping volume coming in not allowing it to go any further south preparing to head higher to ATH’s.

Post-Pandemic reopening : It's a retail showtime!The vaccination campaigns are raising all over the world, but US is doing an incredible job to get this done very efficiently.
I am positive that the retails will spike in the next cycle due to the needs of the people to get back to in-person shopping experiences that are missed for more than a year at this point.
Dillard's performance showings clearly the first signals of this rebound.
DDS is breaking a super old resistance establish back in 2015, and the power of the break it's a clear signal that investors want to take the risk and jump on the long run.
Personally, I will wait for a retest of the resistance and confirm that will be a support to open my long position.

Dillard's off support DDS looks like a good buy off this support area which includes contact with the SMA's.
Great Reward to Risk Ratio if it can near it's previous highs. With everyone starting to put fashion in mind when they start to leave the house that previous high looks possible.
MACD is okay but not our favorite setup but it's a good technical area where we can get 2.68 times our potential loss.


DDS - Bullish triangle - Long positionI will be watching for retracement and if it goes higher, I'm going long
any criticism or tips welcome.

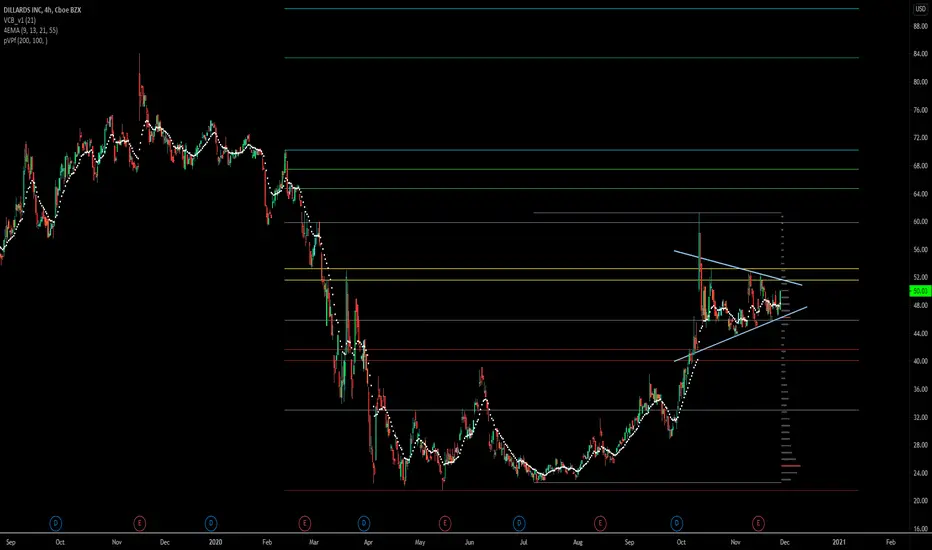
DDS, RSI Indicator left the overbought zone on Oct 19, 2020This is a signal that DDS's price could be shifting from an uptrend to a downtrend. Traders may consider selling the stock or exploring put options. Tickeron A.I.dvisor looked back and found 24 similar cases where DDS's RSI Indicator left the overbought zone, and in 23 of them led to a successful outcome. Odds of Success: 90%. Current price $46.48 crossed the resistance line at $39.15 and is trading between $62.62 support and $39.15 resistance lines. Throughout the month of 09/17/20 - 10/19/20, the price experienced a +41% Uptrend, while the week of 10/12/20 - 10/19/20 shows a -9% Downtrend.
Bearish Trend Analysis
The Stochastic Indicator may be shifting from an upward trend to a downward trend. Tickeron A.I. detected that in 44 of 57 cases where DDS's Stochastic Oscillator exited the overbought zone, the price fell further within the following month. The odds of a continued downward trend are 77%.
Following a 3-day decline, the stock is projected to fall further. Considering past instances where Apple declined for three days, the price rose further in 50 of 62 cases within the following month. The odds of a continued downward trend are 75%.
DDS broke above its upper Bollinger Band on October 12, 2020. This could be a sign that the stock is set to drop as the stock moves back below the upper band and toward the middle band. You may want to consider selling the stock or exploring put options.

