Capitulations or fakeouts are good signalsThis is a long fakeout in the chart of $ENPH. We look at this fakeout after it brakes a trendline and you don't find continuation to the downside after retesting the break.
After this, the fakeouts market liquidates many MANY sell positions and call options that they do 2 things:
Scare the sellers with bad loses
Add tons of liquidity or volume around these prices.
Plus, the MACD gives a delayed, but great signal to ATH. And the fundamentals are looking great:
www.etoro.com
So, I can do 2 things, go for different mini trades in the 4 hours allocating 0.5% to 1.5% of my portfolio and leveraging those either X2 or X5. Or I can go the low-risk option and add a larger allocation, up to 5%, and just let it be there.
1) Short-term trading (swing trades) with low leverage:
The Pros of this strat are having more capital to open other trades like BTC (which is moving now) or just having cash for hedge purposes.
The Cons is the risky trades as I can lose that capital easier in this way as the short-term trades are usually fewer probability trades.
2) Long-term position with higher allocation.
On the contrary, a long-term position is a higher probability trade, not a time-consuming (a simple SL and TP order would do) position, but it allocates a large amount of capital.
I'll try to do half and half this time.
Let me know what you think about this
E0P trade ideas

$ENPH trading it 3/15below 153
140-147 would be target (intraday)
below 140 130 VERY possible... maybe an overnight or swing position if below 140 near close
#daytrading #optionstrading #options

Watching for RS and moving averages to cross upSolar stocks looking strong. Also, see SEDG.
IBD composite 95


$ENPH Reversal Point - Contacted Monthly DemandNASDAQ:ENPH
ENPH has contacted Monthly Demand and is in line with the Monthly Demand that the S&P 500 has contacted.
There are several stocks that are currently aligned with the Monthly Demand of the S&P 500 ** See my profile for more stock scenarios**
As we reach PEAK FEAR in the markets, we are liking to have reached a bottom on the S&P 500

Falling Wedge- Bullish - UpdateENPH looking really nice heading into earnings here. After getting beaten down below the 200-Day SMA where it's previously found support, ENPH just reclaimed the 20-Day EMA & is currently sitting on the 20-Day SMA. Big falling wedge on the daily timeframe and massive hidden bullish divergence on the weekly timeframe (Not Pictured). RSI is finally starting to come out of oversold territory as buyer volume picks back up. Bollinger bands are also squeezing (Not Pictured) in addition to some slight hidden bullish divergence on the 4-hour timeframe. Bullish and will be looking for a breakout from this wedge (Broader Market Conditions Permitting)- Just some support and resistance levels to watch along with some RSI-based supply and demand zones to keep an eye on in the meantime- see previous charts attached below for previous price targets.
- Falling Wedge
- Reclaimed the 20-Day EMA
- RSI Finally Out of Oversold Territory
- Massive Bullish Hidden Divergence on the RSI on the Weekly Timeframe (Not Pictured)
- Bollinger Bands Squeezing (Not Pictured)
- Buyer Volume Picking Back Up
PT1- $143.38
PT2- $145.42
PT3- $146.71
PT4- $148.66 +
--Previously Charted--

Enphase Energy earnings beatEnphase Energy (ENPH) Q4 earnings beat makes a monster pre-market move to the upside. Enphase Energy (ENPH) reported Q4 December 2021 earnings of $0.73 per share on revenue of $412.7 million. The consensus earnings estimate was $0.57 per share on revenue of $396.5 million. Revenue grew 55.8% on a year-over-year basis. The company said it expects Q1 revenue of $420 million to $440 million. The current consensus revenue estimate is $408.11 million for Q1 ending March 31, 2022. Here's levels on the 15 minute chart:
Q4 Results:
EPS = $0.73
Revenue = $412.7M
52 week high = $282.46
52 week low = $108.88
7 day high = $177.50
7 day low = $130.07
breakout = $179.72
R3 = $178
R2 = $176.27
R1 = $174.54
pivot = $172.81
S1 = $171.08
S2 = $169.36
S3 = $167.63
breakdown = $165.90
Do your own due diligence, your risk is 100% your responsibility. This is for educational and entertainment purposes only. You win some or you learn some. Consider being charitable with some of your profit to help humankind. Good luck and happy trading friends...
*3x lucky 7s of trading*
7pt Trading compass:
Price action, entry/exit
Volume average/direction
Trend, patterns, momentum
Newsworthy current events
Revenue
Earnings
Balance sheet
7 Common mistakes:
+5% portfolio trades, capital risk management
Beware of analyst's motives
Emotions & Opinions
FOMO : bad timing, the market is ruthless, be shrewd
Lack of planning & discipline
Forgetting restraint
Obdurate repetitive errors, no adaptation
7 Important tools:
Trading View app!, Brokerage UI
Accurate indicators & settings
Wide screen monitor/s
Trading log (pencil & graph paper)
Big, organized desk
Reading books, playing chess
Sorted watch-list
Checkout my indicators:
Fibonacci VIP - volume
Fibonacci MA7 - price
pi RSI - trend momentum
TTC - trend channel
AlertiT - notification
tickerTracker - MFI Oscillator
www.tradingview.com

final price target may hit soon 🚨enph breaking below trend support/struggling to hold local support, and now its being held back by trend resistance again.
If our markets continue to sell off the next target for ENPH is 92.62.
like and follow for more! 💘

Nice weekly flatI have already posted this idea earlier
Now it seems there is a nice entry point, although, quite on a minor time frame for such a big trade
Nevertheless..))
Have a nice weekend!

ENPH - just look at ATVI todaySimilar flat pattern.
Daily - wave C of the flat has already broken FE100 on regular scale.
The chart is on LOG scale, still some downside possible, but the structure looks really ok)
Good luck!

ENPH - bounce here? on watchVery strong support here
Oversold RSI
Can bounce from here at least to 177
Good fundamentals and forecast

ENPH Great R:RName that we don't play often, but still has some juice left to squeeze both ways. Looking for a bounce of $143.49 for a play to 157 gap fill if market wants to relief bounce.
Any daily close under 143.49 leads us to $130 and possible $108.

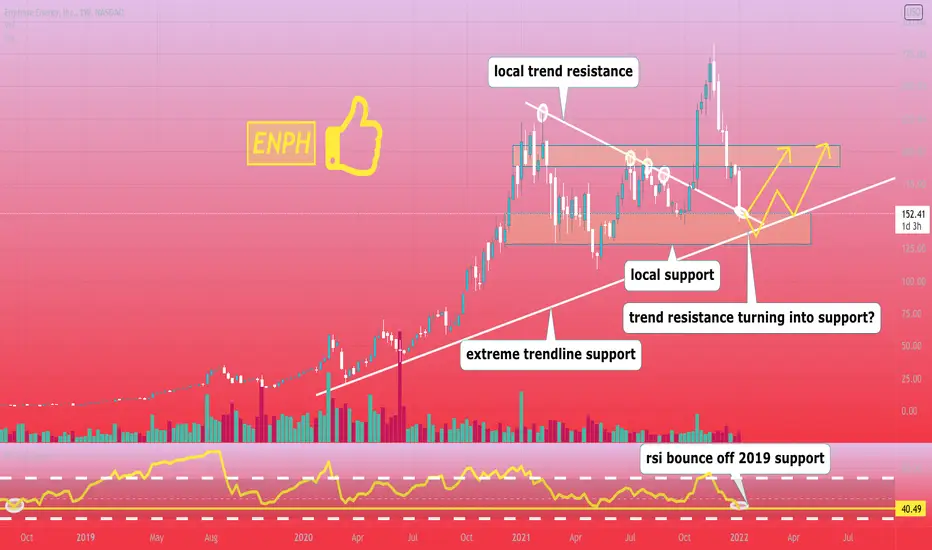
loving this setup! on my watchlist for next week 🦉enph could be using previous trend resistance as support now, also near local/extreme trendline support.
on top of that we are bouncing off rsi support from 2019! This is what I call cluster support :D
These are all good signs for a low risk risk long entry.
like and follow for more 💘
ENPH In For a Rough 2022Enphase has performed incredibly well since the Covid 19 outbreak in March of 2020. ENPH has attracted overwhelming investment attention from retail investors and institutional investors during this time, this is partly because Enphase is a solar panel semiconductor company. Both Semiconductors and Solar have been hot sectors since the start of Covid, I believe that this trend will reverse as interest rates move higher from direct action of the Fed in 2022. This should result in investors moving into more defensive investments like consumer staples, energy, utilities, and bonds. All the while ditching shares of the speculative growth names in their portfolio like ENPH and others.
Taking a look at ENPH's technical setup, it is apparent that momentum and investor sentiment is shifting into a more negative state. One quick way to backup that thesis is looking at Enphase's lowered trading volume as of the last year and a half. Another big negative sign is the MACD on the monthly timeframe showing a bearish cross. And lastly ENPH price grinding up against the two year support trend line(denoted as the dashed red line). If or when ENPH breaks below the 2 year support line, expect a steep decline in price. With all that being said, my prediction for the price of ENPH stock during the next year of trading is at least a 35% decline from the current price of 159.85.

ENPHso based off recent uptrend support zones, 168-167 should see a solid bounce, as long as we dont lose this support of course, this area could be a solid buy zone seems like more downside until then

LONG ENPH BIG+% returns Bounce off trend
good ROI
Revenue per employee high
not overbought
earnings is not soon
high beta
3 month and 6 month performance is great
Warning High PE

Falling Wedge- Bullish - UpdateENPH starting to look really nice here after pulling back to the 200-day EMA following new ATHs. Big falling wedge forming on the 4-Hour and Daily Timeframes. Certainly a longer-term play, however, bullish and will be looking for a breakout from this wedge (Broader Market Conditions Permitting). Just some support and resistance levels to watch along with some RSI-based supply and demand zones to keep an eye on in the meantime- Bullish and looking for a breakout, see previous charts attached below for previous price targets.
- Bullish Hammer off the 200-Day EMA
- RSI in Oversold Territory
- Falling Wedge
- Slight Gap to FIll on the Upside
- Holding Above VWAP on the 4-Hour (See Attached Chart Below)
- Falling Wedge on the TAN ETF as well
PT1- $185.37
PT2- $187.64
PT3- $189.36
PT4- $191.48
--4-Hour Timeframe--
--Previously Charted--
--TAN--

Big level retest (stock idea): ENPH DailyA lot of confluence here on ENPH, a leader in the solar energy group:
- Trend line retest
- Bounce off the 200dma
- Gap filled and bullish engulfing on the daily
- Horizontal support tagged
Watch for a base to build as it tries to clear overhead resistance that's still ahead - on the daily it's still below the 10,20,50 moving averages, so it's likely to remain choppy even if it bounces from this level. I like that it's retesting its power earnings gap from late October - something to watch from here.
Last analysis on ENPH:

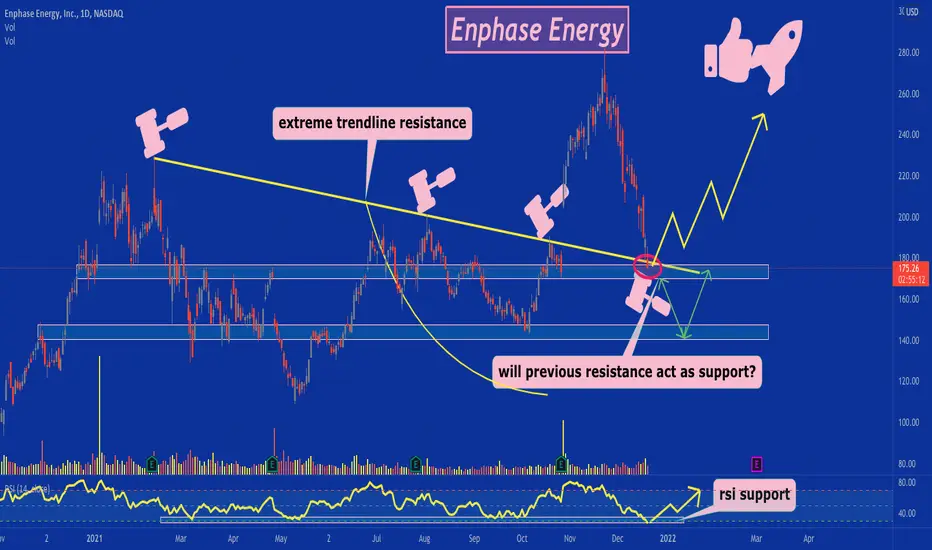
make it or break it area on ENPH, get the popcorn!🍿 nuetralenph approaching extreme trendline resistance zone, Must act as support or the bulls completely lose control! if we hold this area an bounce we could see a all time high test in 2022.
below 170 support id look for would be around 140-146, if we hold here and break 200-218-250
like and follow for more! 💘
Selecting the best of the best of the Russell 2000There is the gap that has been pretty much filled and bullish divergence on the MACD and an uptrend trendline. I think it is a good buy between $185-$165

Big Pullback in Enphase EnergyEnphase Energy made a big move between early October and late November, ripping from $145 to a new record high above $280. Now after a healthy pullback, traders may start to notice.
The first pattern on today’s chart is the 50-day simple moving average (SMA), which ENPH tested yesterday for the first time since breaking out.
Next, the low was near the stock’s previous highs in January and February. Can old resistance become new support?
Third, the pullback dragged stochastics to an oversold condition. That could also make some investors think it’s due for a bounce.
Finally, ENPH is the largest holding in the Invesco Solar ETF . TAN has been struggling this year following a big rally in 2020. But its 50-day SMA crossed above its 200-day SMA in mid-November – a potentially bullish “Golden Cross.”
TradeStation is a pioneer in the trading industry, providing access to stocks, options, futures and cryptocurrencies. See our Overview for more.
Important Information
TradingView is not affiliated with TradeStation Securities Inc. or its affiliates. TradeStation Securities, Inc., TradeStation Crypto, Inc., and TradeStation Technologies, Inc. are each wholly owned subsidiaries of TradeStation Group, Inc., all operating, and providing products and services, under the TradeStation brand and trademark. When applying for, or purchasing, accounts, subscriptions, products and services, it is important that you know which company you will be dealing with. Please click here for further important information explaining what this means.
This content is for informational and educational purposes only. This is not a recommendation regarding any investment or investment strategy. Any opinions expressed herein are those of the author and do not represent the views or opinions of TradeStation or any of its affiliates.
Investing involves risks. Past performance, whether actual or indicated by historical tests of strategies, is no guarantee of future performance or success. There is a possibility that you may sustain a loss equal to or greater than your entire investment regardless of which asset class you trade (equities, options, futures, or digital assets); therefore, you should not invest or risk money that you cannot afford to lose. Before trading any asset class, first read the relevant risk disclosure statements on the Important Documents page, found here: www.tradestation.com .

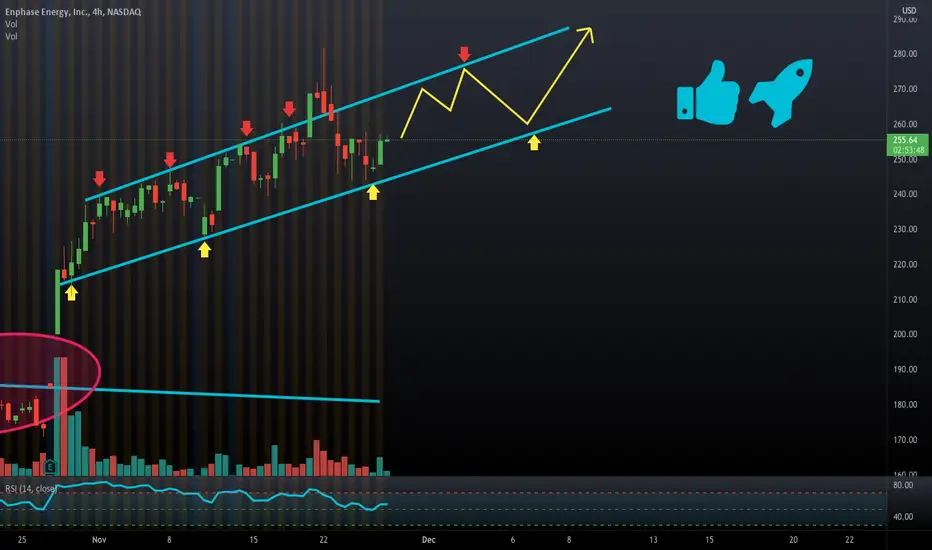
🔋updated ENPH analysis🔋enph creating a bullish trend channel after breaking the big downtrend trend resistance recently, if it holds we can look for a push to 300+ in 2022 or late December.
you can see when the downtrend clearly broke in this picture
💘please like and follow for more ! thanks
$ENPHnot really intersted in this one,, doubt we will pullback but dont know if does can be a great play
