E0P trade ideas


ENPHASE ENERGY INC (ENPH) CANSLIM METHOD william oneilThis Is The best performing stock of the year. 160% growth in 1 year,
Acording to th William oneal CANSLIM method this can be a good performing stock to look for if it is able to break th 19.50 point price...
EPS ratings are not so good at 76
but RS and composite ratings are over 97


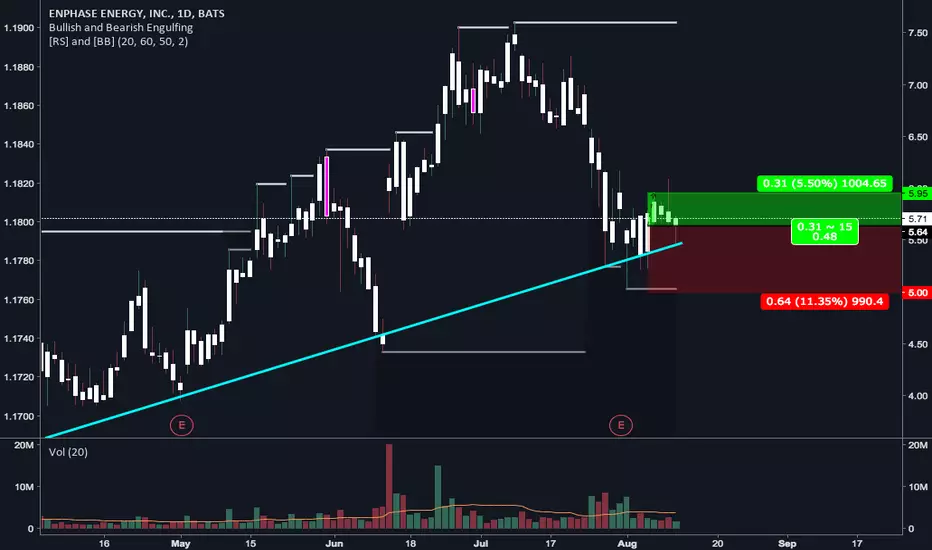
Short Options Trading: ENPH Buy Put $12.50 Exp: 8/16Understanding The trade:
As an options trader my goal is to identify trend change and utilize a breakout strategy to leverage profit off of major trend changes with minimal risk. Even though this contract does not expire till 8/16 I will be looking to take profit by late July as the rate of decay factor starts to come into play as the contract approaches expiry. This should correlate nicely with the Fib Retracement lvl .618. If you have any questions, please feel free to comment below and follow. Thank you and trade safe.
Reasons For Trade:
• Rejection off the ATH of $18.00 Back in Sep 14’
• RSI Broken upward channel (1D chart Jan 1st -July 2-tj)
• RSI Overbought > 70
Trade Parameters:
• Broker: Robinhood
• Cost For Entry: Free
• Contracts: 3
• Entry Price: .45
• Risk: $135
• Reward: $135
• ROI: 100%
• Risk/Reward Ratio: 1:1

ENPH Test of all time highThe buying pressure has been strong over the past few months on a test of the all time high. But this market is still in a large trading range, and the buying pressure is climactic. This is more likely a buy vacuum test of the high of the range than the start of a strong bull trend. Instead, there will probably be profit taking around or above the all time high which is just above. The bulls will need a strong breakout above and follow through before a trend is likely to begin. The bull gaps below around $10 will also likely need to be tested first.
If you found this helpful, please like and share! Feel free to comment or ask questions

ENPH outlookThe weekly and the daily both line up clean on enph and the are following the Fib levels up. Each of the moves have been measured moves. The first move from 1.39 to 7.63 was 634 points and the move retraced 38.2% to begin the current move. This move started at 3.76 a 634 point move be near a completion of the 2nd move near 10.01 the rejection area. I'd expect retracement to the 38.2 to around 6.11 and a complete of the third move to the high of 12.43.
Daily markup:
Weekly markup:

ENPH LongPull Back Trading
Price above the cloud ( bullish )
Above 200MA ( bullish )
Buy $7.23
Take Profit $9.09 and(or) $9.65
Stop Loss $6.60
Thank You
All comments are welcome

ENPH outlookThe weekly and the daily both line up clean on enph and the are following the Fib levels up. Each of the moves have been measured moves. The first move from 1.39 to 7.63 was 634 points and the move retraced 38.2% to begin the current move. This move started at 3.76 a 634 point move be near a completion of the 2nd move near 10.01 the rejection area. I'd expect retracement to the 38.2 to around 6.11 and a complete of the third move to the high of 12.43.
Daily markup:
Weekly markup:

ENPH LONG with tied SLENPH is a stably fast grow solar company that gives a real fight to solaredge (SEDG)
as you can see on the grap 4 area was a support area for the stock . on the weekly there is a 2 pattrens that formind - small W and cup and handle.
But and there is a but - due to the market volatility i want to take this trade with a tied stop.
G luck !


***Good breakout candidate***Buy above yesterday's high 7.60. See the chart for more details.
Please like, comment and follow if you like my ideas. THANK YOU!!!
Please note that this information is not a recommendation to buy or sell. It is to be used for educational purposes only.

Weekly TTM Squeeze SetupSo, assuming this weekly candle holds up, ENPH has a really nice TTM momentum squeeze setup on the weekly chart. For comparison, the last time ENPH had a squeeze breakout like this was July 2014. Here's the chart:
Over the course of ten weeks, ENPH ran from sub 10.00 to a high of 18.00! Past performance in no way guarantees future results, but the point is that if you trade a a squeeze breakout on the weekly chart, you can really make some money. And the setups are very similar between July 2014 and January 2019; ADX below 20, RSX above the midline but below the oversold line with a strong upward direction. The RSX for the current setup is less oversold than the the start of the July 2014 breakout, so there's an argument that this one may have even more "juice" than that one.
I predicted we'd see 6.75 by the end of January and we hit it a couple of weeks earlier than I expected. I predict that this setup breaks 8.00 before the end of March.

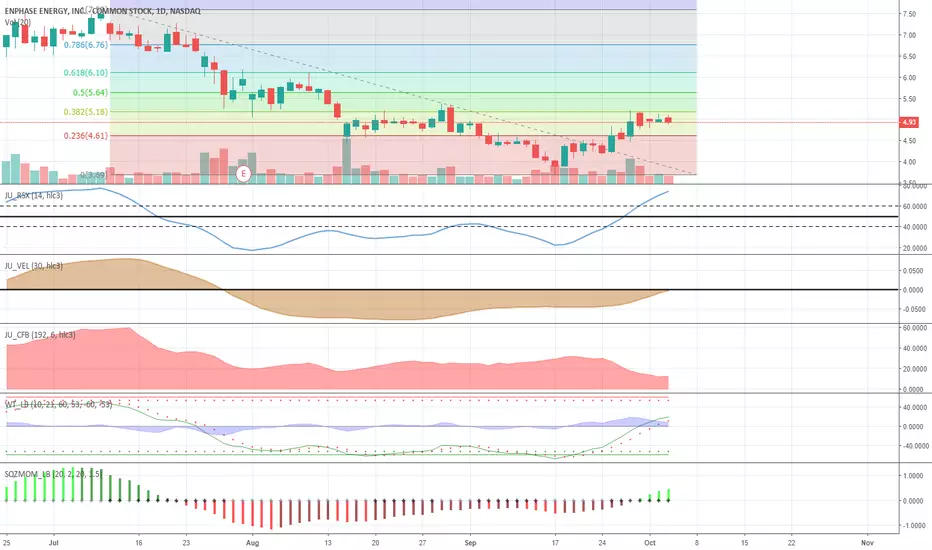
ENPH Breaking Upper ResistanceThe test for the immediate future will be to see if ENPH can hold its price above the resistance line formed from June 27 and Dec. 4 highs. The RSX says it's moved into oversold territory, but historically ENPH has shown the ability to push the RSX much higher than 70. I'm watching the DPMO crossover closely on the daily chart. If it stays green a few more days, I think this run has serious legs. The EMA20 crossed above SMA50 on the daily, which is encouraging. Next hurdle is 6.34, then we could see a rapid climb over 7.00. If it drops back below the old resistance line, look for a pullback near SMA50 (turquoise blue line on the chart).

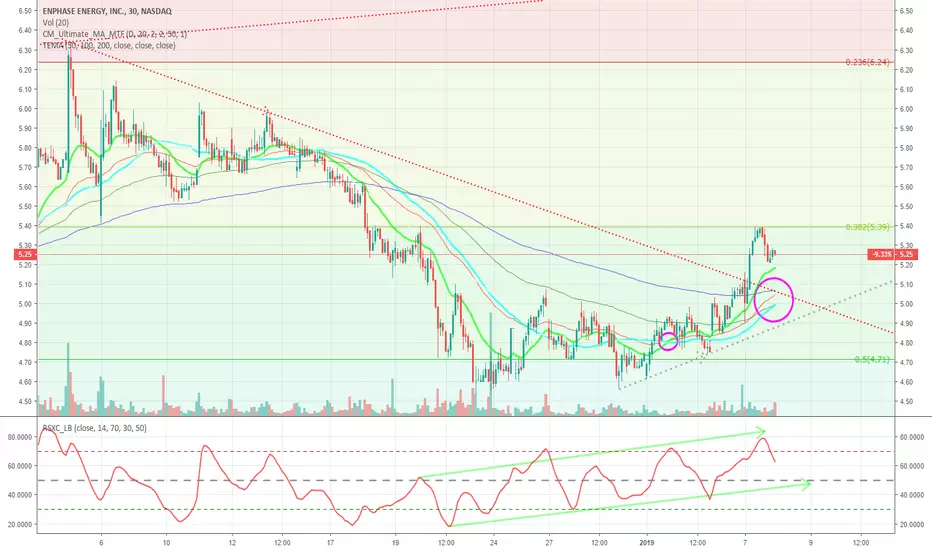
ENPH Bull Crosses Coming on 30-Min ChartThe 30-min chart shows that the EMA20 has already crossed above the SMA50, and the SMA50 is about to cross above the TEMA50/100/200. The TEMA50 has already crossed above the 100 and is quickly converging on the 200. These crossing patterns have preceded strong runs for ENPH since September. Yesterday it broke through the upper resistance trend line for this pullback. I predict ENPH will see $6.75 before the end of the month.
Release the Squeeze!ENPH is right on the edge of a squeeze release. I think if it can run up to 6.10-6.15, today, we'll see a release and a breakout

ENPH Enphase Energy setting up right shoulder on BIG H&S NASDAQ:ENPH forming pretty big H&S here.
What to look for the short:
a Daily 8 / 9 TDsell SetUp not much higher than left shoulder
or
a bearish color flip on the daily candles without breaching daily swing high.
Will Update if short taken.

Inverse Head and Shoulders PatternEnphase Energy Inc. (ENPH), Temporality 5D.
Following a downtrend; on Oct 24 an inverse head and shoulders pattern is shown in the chart. despite the first shoulder has the same height as the head, a breaking of the neckline occurs, reversing the trend to an up trend. A rise of volume at the moment of the breaking, confirms the pattern.

head and shouldersIs this too far of a time spread for a head and shoulders pattern to suggest a reversal?

pennant pattern, but is this an established uptrend yet?I see a pennant pattern formed here and the current uptrend although short has tested the last support level. How can we tell if this pennant (rest) is part of a new trend to the upside and go long just yet ?

ENPH Consolidation: Powder Keg or Time Bomb?I've been watching ENPH for a couple of months. Recent retracement has been encouraging but there's been significant consolidation the last few days between 4.80 and 5.00. A very large percentage of the float has been shorted. Jurik indicators show rising RSX (smoothed RSI) and that the negative VEL (MOM) has been eliminated. The squeeze is on and ENPH is poised to move drastically - the question is, which direction?
I'm betting on another upward climb. It could be today or consolidation could continue into next week. I could also be completely wrong - especially so if the technical indicators are being skewed by market manipulation of those who heavily shorted this stock. What you need to watch for is volume - I believe that the first significant uptick in volume will release the squeeze and light the powder keg.
Good luck to all.
ENPH Long - 5% GainShould find an easy 5% gain this coming week as ENPH bounces off trend and retests the 6.00 mark