ENPH potential breakout soon ENPH potential breakout once this demand fair value gap below is retested
look for a recovery of the high volume node above to act as a shelf to push price upward upon a confirmed hold
E0P trade ideas

ENPH inverted head and shoulders.Looks like a longer term inverted head and shoulders combined with a shorter term inverted head and shoulders. Showing good relative strength. Will be watching closely to see if it can hold above resistance this week for a long position.

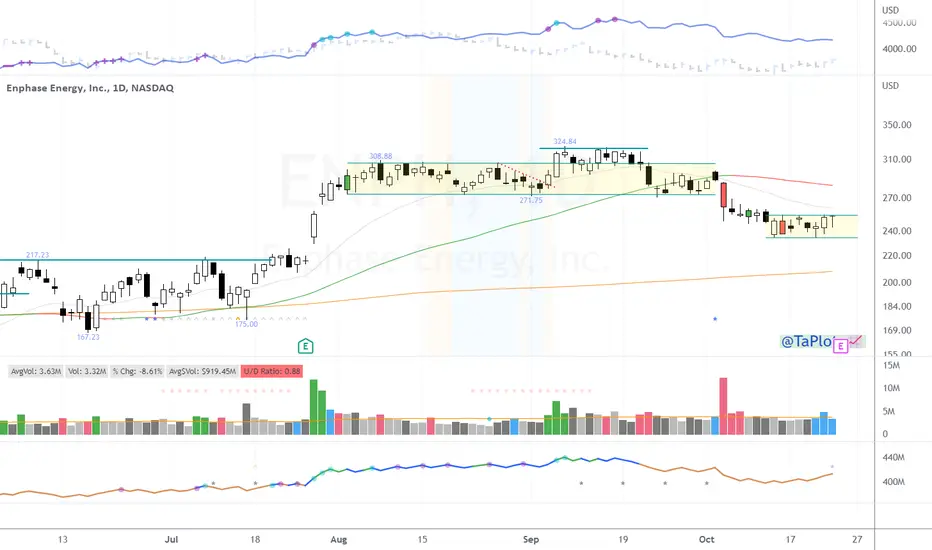
🟩 $ENPH - added last week$ENPH has been showing the characteristics of a Market Leader - I bought last week. Here is why:
1. Confirmed Stage 2 uptrend
2. 11 week constructive base (Cup and Handle pattern)
3. Strong RS rating
4. Breakout Year on EPS
5. 2 Quarter EPS acceleration

Enphase Energy Analysis 18.11.2022Welcome to the BasicTrading channel.
My name is Philip and in todays analysis I quickly go over the situation which we currently have on Nas100 .
I will analyse the asset both from a weekly and daily timeframe to show you the best possible trading opportunities.
If you enjoyed this analysis, let me know in the comment section which asset I should analyse tomorrow.
I will personally reply to every single comment.
Dont forget to smash that rocket and I will see you tomorrow with a new analysis.

ENPH - Big play potential here! Massive Double TopEnphase Energy, leader in Solar & Green Energy Sector.
Enphase has recently seen parabolic performance skyrocketing the stock to All Time Highs.
While the stock is testing all time highs, it is still very overvalued with a P/e of 150.
The bear market has not taken its toll on Enphase yet, while it has been rising in this clear rising wedge.
What I see:
- A clear Double Top being Printed in Large Supply Zone
- Rising Wedge
- Overvalued
- Hasn’t got Bear market hit yet
Risks :
Earnings Growth
Market Meltup rally
Break above zone from possible cup & handle formation.

$ENPH Setting up Cup with Handle$ENPH probably pissed off few traders with early strength Friday and reversal.
This potentially improves the setups with it putting 3rd and final contraction before breaking out.
Orange bars is what I would like to see to get me interested.

trend resistance zone is extreme! longs should be careful here🔴pointed this trend resistance zone out on august 22nd, since then we have seen 2 perfect rejections..
I am expecting a dip to 222-270 before next leg up here on ENPH, bearish short term bullish long term 🚀

$ENPH with a Bullish outlook following its earnings #Stocks The PEAD projected a Bullish outlook for $ENPH after a Positive over reaction following its earnings release placing the stock in drift B with an expected accuracy of 80%.
ENPH - Continued DowntrendLooking to meet the .5 retracement going into earnings. Unless they have some outstanding news I don't see this momentum dying in the current conditions after the rally solar has had. Watching this into next week to enter on any pops. RSI looks to be oversold but has room for continuation down to around 14ish (D, 14) while the trailing 24 MA on RSI continues to trend down. MACD also showing continued strength down.

ENPH10. 27. 22 ENPH This is a very bullish market which correct about 100 points lower to a 382....And looks like it's going to make new highs.

Short idea #5Hey, I think ENPH drops, and significantly so. I'm not shorting yet, but I'm posting my idea ahead of time. I WILL short this when SPY hits $390


$ENPH in a Position to Move Ahead of Earnings $ENPH reporting after the close tomorrow according to TOS.
Sitting at a spot to make a move.
I wont be taking a position ahead of that number.
ES1!10. 24. 22 There is a big distinction between the US dollar going higher and the es going higher. This difference change is my strategy, and it would change my strategy if I were trading in the equities market.


ENPH: Pull Back + Bounce + Active Level RetestBig Picture:
Earnings coming up 10/25/22. Had good Earnings last time. Coming back into aggressive buying from July and last earrings period. (Will the buyers want to fight for the price a little bit now before earnings?)
--------------------------------------------------------------------------------------------------------------------------------------------------------------------------------------------------------------------------------------------------------------
Setups:
07/20/22 - 07/27/22: ENPH broke out out from a volume accumulation + Aggressive Buying
08/02/22 - 09/06/22 Volume Accumulation
09/15/22 - 09/21/22 Volume Accumulation
09/22/22 Aggressive Selling
09/26/22 - 10/04/22 Volume Accumulation
10/05/22 - 10/07/22: Aggressive Selling
--------------------------------------------------------------------------------------------------------------------------------------------------------------------------------------------------------------------------------------------------------------
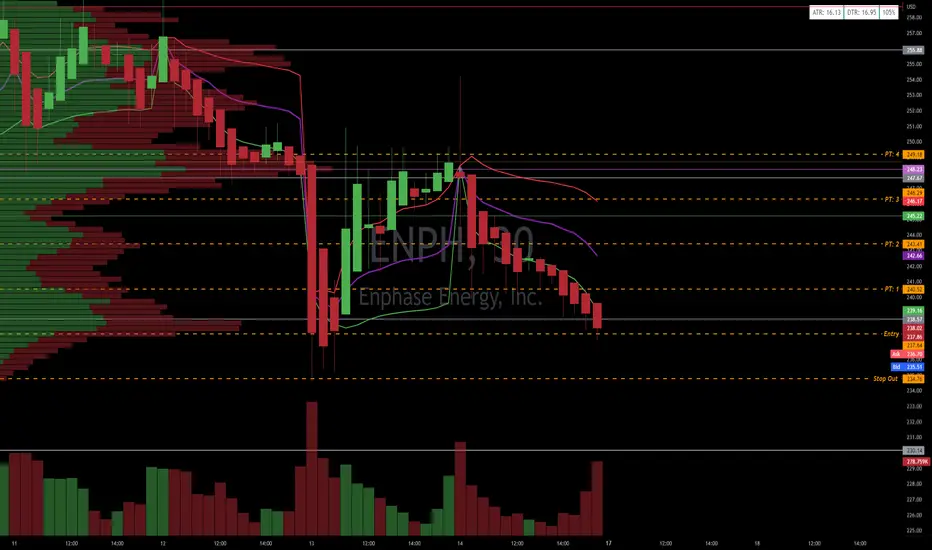
Intraday Technical:
ATR: 16.13
ATR (200Day): 14.42
DTR: 16.95
%: 105.00%
RVOL: 0.82
Rel Vol (Finviz): 0.75
RSI (14 Day): 30.64
RSI (200 Day): 52.51
Volume: 2,884,739
AvgV: 3.83M
Ch% (FINVIZ): -4.35%
FS%: 3.31%
Shs Outstanding: 135.20M
Shs Float: 132.68M
Inst Own: 75.10%
2 Day VWAP: 244.6
Weekly VWAP: 250.33
Monthly VWAP: 263.01
--------------------------------------------------------------------------------------------------------------------------------------------------------------------------------------------------------------------------------------------------------------
10/13/22
Open: 248.73
HOD: 254.21
LOD: 237.26
Close: 244.59
--------------------------------------------------------------------------------------------------------------------------------------------------------------------------------------------------------------------------------------------------------------
Key Areas of Support:
216.82
230.14
245.49
--------------------------------------------------------------------------------------------------------------------------------------------------------------------------------------------------------------------------------------------------------------
Key areas of Resistance:
257.08
283.43
295.02
315.29
Inflection Point:
245.35
--------------------------------------------------------------------------------------------------------------------------------------------------------------------------------------------------------------------------------------------------------------
Trade Plan:
Look for a pull back to 237.64
If pulls back to 237.64 and see absorption then start long.
If blow through VWAP then Cover and look to add back in a pull back. If add in pull back this is a new trade and make sure to cover this new add at the next neck line.
If hits PT 2 then look for a pull back with absorption and add. Then sell this Add right into the above neckline.
Take original trade to PT 3 and sell
Risk/Reward: 20% of ATR $2.88
Entry: $237.64
Stop $234.76
Exit: $249.18
PT 1: $240.52
PT 2: $243.41
PT 3: $246.29
PT: 4 $249.18
ENPH daily bearish hammer wave 3 downtrendENPH daily bearish hammer wave 3 downtrend.
Buy Stop 275.06 GTC
Buy Limit 219.53 GTC

ENPH all time high indecision candleENPH all time high indecision candle had to take this one weak entry.

ENPH will die a horrible deathHey, ENPH is a done stock. I can't say when exactly it will fall, but I've long speculated solar is the most bearish sector looking to year-end because it has so much room to fall; nothing has changed. Keep an eye on this name, it's going to fall, hard. I'd only ever look for short opportunities on this name; don't even think about buying this one long- even for a bounce.
For reference, this name moves with SEDG. Look how far down SEDG is... ENPH has a lot of catching up to do to the downside.

#ENPH lagged the general market today$ENPH lagged the market today but not suppressing the level if found some sellers around.w
Orange bars would be an ideal setup heading into end of this week and early next week.
Still top stock to keep eyes on.

Forming head and shoulders?Looks like it is forming head n shoulders pattern. It is at its resistance now. It may fall back towards $200 soon.


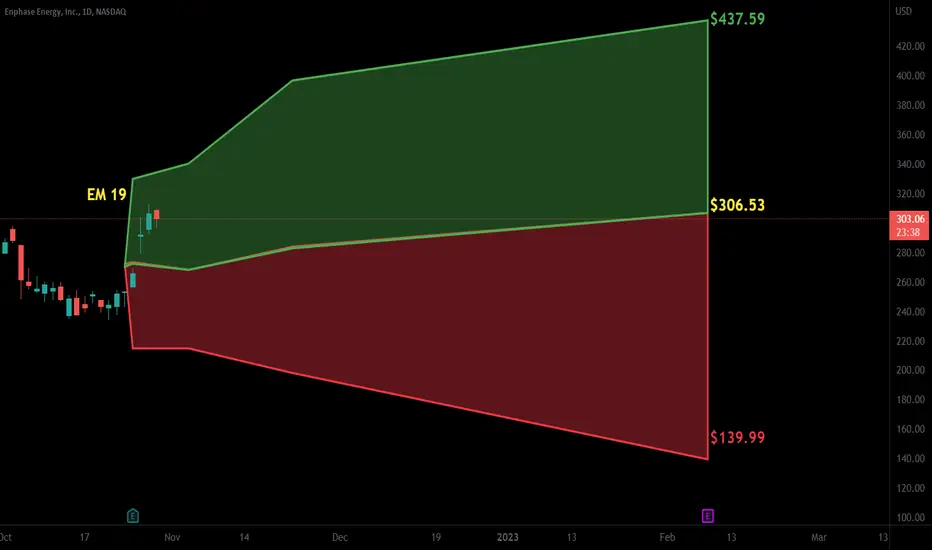
ENPH doing W3 with a bullflag to 387, then W5 to 498?ENPH has been on a staircase to heaven fueled by the govt support on solar energy & the current supply
chain crisis on crude oil & natural gas.
The near term destination of the bullflag will be 387. After that a wave 4 correction may follow before the
final leg up to 498 for wave 5.
Not trading advice
