ERT trade ideas

How to Trade the Cup and Handle Chart PatternBuy when the price breaks above the top of the channel or triangle. When the price moves out of the handle, the pattern is considered complete, and the price is expected to rise.
While the price is expected to rise, that doesn't mean it will. The price could rise a little and then fall, it could move sideways, or it could fall right after entry. For this reason, a stop-loss is needed.

$EA - Alert set for breaking above 142.55$Potential Long entry for breaking above 142.55$
Main support MA50 + Horizontal area, 134.63$
In my point of view, EA has to be focus on Marginal Profit improvement for the next quarters.
Not recommended to buy or sell EA stocks.
Just an Idea,

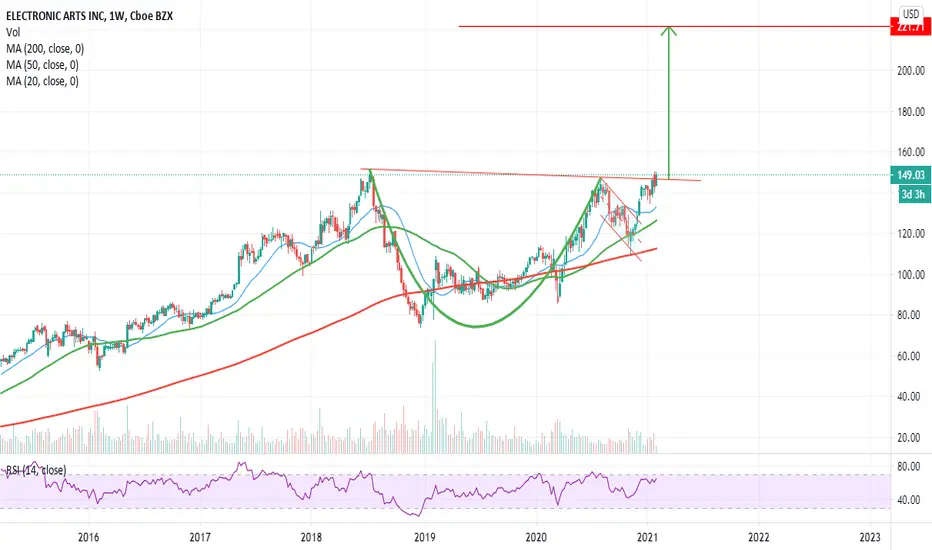
EA formed a hug cup&handle and is now breaking outNASDAQ:EA is looking bullish and ready for another run. This a long term play that requires patience, target is 221.7$, stop 110$.
Hit the like button and follow if you find this useful :)
This is only my own view and not financial advice, do your own analysis before buying or selling
Happy Trading!

Cup and HandleNo rising wedges in the yearly chart..
Support can be found at Mid cup (MC) or HL (handle low)
Targets are calculated using the depth of the cup which is 37.21 then added to long entry level using fib levels. Long entry is a bit higher than cup high to get through the R that may lurk there..
This is in my list of favorite stocks. I have 15..lol..so do not listen to me/do your research..
Long term high is 151.26 as well as 3 year high/.
Not a recommendation

Cup Handle Pattern Easy cup and handle pattern for EA.
Coupled with the good news for boost in gaming spending because of the pendamic and earning report coming in really close. It makes sense for a breakout upwards.
In case of breakout, hoping to reach 166$
NOTE:
This is my personal opinion and not a financial advise

Is EA near a breakout in a cup and handle pattern?I'm new to trading cup and handle patterns. I came across EA. To me, and it looks like it's at the tail end of a cup and handle and that a breakout could happen soon. Am I correct in my assessment here? Any input would be much appreciated!

EA BUY OR LONG , TARGET UP TO $220EA was able to successfully validate the " Cup And Handle " pattern this week at $150 I will buy here .
EA buy : $150
EA target : $220
EA stop loss : 10% or $140
Wish you good deals!

EAWe have a formed C&H pattern, the final target and timing of achievement is $ 221, May-June 2021, an overall growth of 49%. There are 2 intermediate targets, defined by two Flag patterns - 176 and 208 dollars, which will be reached quickly enough. The paper is fundamentally strong, this moment can be seen as a good point for a mid-term entry.


NASDAQ:EA Possible Cup & Handle Breakout OpportunityI like the Weekly setup on this NASDAQ stock because the price is very close to breaking its ATH's and the cup and handle formation along with the widening wedge allude to big upside. The Yearly R1 Pivot @ 165 would be a realistic initial target with the Yearly Pivot @ 125 offering support should the breakout initially fail.


EA flies the flagVideo gaming stocks are strong overall with $ATVI hitting a new high in late Dec and $TTWO hitting one this week. $EA surged and then consolidated with an imperfect flag. This is still a consolidation after a big move and a bullish continuation pattern.

EA Coiling Suggest 144 Comes Soon, If History Repeats?Gaming hasn't really been affected like other markets regarding the political shift in the U.S. Stay at home 2020 orders helped boost gaming revenues and it doesn't seem like it'll slow down anytime soon. 2021 lockdown orders in the UK and possible covid variants could be a buy and sell the news for at home stocks like EA, TTWO, ATVI.

IT'S IN THE GAME!Looking for a squeeze to test $147 again then if we break that wall on to $150! I plan to scale in at $143 or lower with debit spreads with Jan 29th or Feb 5th exp. LMK what you think and what your plan is!

EA Ready For Higher Prices?With the stay-at-home orders still in place and many spending majority of their time at home, video games are seeing a surge in player activity. EA seems to be moving and "potentially" formed a Cup & Handle pattern. Would like to see a confirmed break above the $128 resistance on the daily chart, then a weekly close above $147.

Ichimoku entry EAconsistent strength through the cloud, I'm not sure if that's good or bad honestly. A relatively big name for my humble list, excited to see if the strategy pans out on this one.
Trailing stop of $1.27 to be entered at price target $138.46. Stoploss at $130.89

$EA at resistanceLet the bag holders shake out, if/when we make it above the $138-$140 level, we are melting up again
Still love this stock along with ATVI. It is finally getting the attention it deserves from analysts and algos

$EA - a lot like ATVIContinue to make $$ every other day buying and selling options.
The trend is our friend. Continue to play this stock until the trend reverses or the stock pulls back to take a break.
Will be buying the dips and continuing tracking daily progress.

