Keeps on GoingIt looks like a cup has formed but is lacking a handle at this point.
T1 has been met.
Earnings miss yet back up again.
ATH is 317.
No recommendation
F3A trade ideas

17/11/22 - Solar Sector Strong Solar sector strong as a whole, showing relative strength. Leaders are $FSLR (actually trying to break out today) and $ENPH.

TIME TO SHORT SOLAR SECTOR FSLR TOPPEDI am now moving into puts in FSLR as of this morning >look to move to a net short at 75 % in the money puts look at 2023 puts only .We should a rather large drop back to 100/115 easy

FSLR shortIF SPY REACHES 389 TODAY, I'LL BE SHORTING THIS. Grateful this didn't dump on earnings. I think it will fall heavily thru November. Would look to stop out if highs get plowed through, which I doubt happens.

FSLR -- Long--Breakout from W pattern for base/support
--Stock drop 8% on ER, gain 1.5% in pre-market
--Look like there still demand for green energy
--ENPH has good ER and gain 9% on the open
--Indicate entry signal on ER.
--Could be high reward and high risk, because of ER was not that great, but not as bad.

Weekly Chart/Earnings 10-27 AMCPrice is still above the .236 of the trend up.
This level seems to be support for now.
Short interest is around 4.9%.
Earnings are scheduled for Thursday after market closes.
Short for the longer term.
No recommendation.
Target 1 is in larger orange type followed by T2 and T3 which are in smaller type.
Daily Chart:

FIRST SOLAR INC.Thursday, 20 October 2022
21:15 PM (WIB)
Leading the World’s Sustainable Energy Future
Founded in 1999, First Solar is a leading American solar technology company and global provider of responsibly produced eco-efficient solar modules advancing the fight against climate change. The company is unique among the world’s ten largest solar manufacturers for being the only US-headquartered company and not manufacturing in China. First Solar’s advanced thin-film photovoltaic (PV) modules represent the next generation of solar technologies, providing a competitive, high-performance, lower-carbon alternative to conventional crystalline silicon (c-Si) PV panels.
Manufacturing Leadership
First Solar has the Western Hemisphere's largest solar manufacturing footprint in Ohio, USA, with a third factory set to come online in the state in the first half of 2023 and a new factory, the company's fourth American manufacturing facility, expected to be commissioned in the US Southeast in 2025. The company will have a global annual manufacturing capacity of over 20 gigawatts (GW) by 2025, with a footprint that spans the US, India, Malaysia, and Vietnam. First Solar thin-film PV modules are produced using a fully integrated, continuous process under one roof that does not rely on Chinese crystalline silicon (c-Si) supply chains. Its proprietary, vertically integrated process transforms sheets of glass into fully functioning solar panels in approximately four hours with a combination of highly skilled workers, Industry 4.0 architecture, machine-to-machine communication, artificial intelligence, and Internet of Things connectivity.
Technology Advantage
Designed and developed at its research and development center in California and Ohio, First Solar’s advanced thin-film PV modules set industry benchmarks for quality, durability, reliability, design, and sustainability. Each module features a layer of Cadmium Telluride (CadTel) semiconductor, derived from by-products of copper and zinc mining, which boasts a number of qualities over conventional c-Si, including lower cost, superior scalability, and a higher theoretical efficiency limit.
First Solar’s thin-film PV technology produces energy-efficient modules with a superior degradation rate, temperature coefficient, spectral and shading response, and the smallest environmental footprint in the industry. First Solar's thin-film modules require only 1-2% of the semiconductor material needed by traditional c-Si modules to produce a comparable amount of power. The company’s vertically integrated manufacturing technology results in fewer process steps and faster production times with superior traceability and transparency.
Responsible Solar
From raw material sourcing and manufacturing to end-of-life module recycling, First Solar’s approach to technology embodies sustainability and responsibility towards people and the planet. This is why First Solar has a long history of establishing benchmarks in recycling, responsible supply chain management, transparency, and the carbon and water footprint of its technology.
First Solar’s thin-film PV modules have the best environmental profile and are manufactured using less energy, less water, and less semiconductor material, resulting in up to 2.5x lower carbon footprint and up to 3x lower water footprint than c-Si solar panels on a life cycle basis.
First Solar is a member of the Responsible Business Alliance (RBA), and in May 2022, completed its first RBA Validated Assessment Program audit at its Ohio manufacturing facilities, achieving platinum status, the highest possible rating. Additionally, First Solar has committed to powering 100% of its global manufacturing operations with renewable energy by 2028 and achieving Net Zero by 2050.
For more details please visit First Solar Inc.

FSLR:No more Sunshine?!FIRST SOLAR
Intraday - We look to Sell at 121.86 (stop at 130.09)
Following yesterday's bearish candle, the overall trend lower looks set to continue today. We look for a temporary move higher. Resistance could prove difficult to breakdown. Preferred trade is to sell into rallies. Our bias remains bearish and further downside is expected to target support at 100.00.
Our profit targets will be 101.77 and 90.00
Resistance: 122.00 / 145.00 / 196.00
Support: 101.80 / 63.00 / 31.00
Please be advised that the information presented on TradingView is provided to Vantage (‘Vantage Global Limited’, ‘we’) by a third-party provider (‘Signal Centre’) . Please be reminded that you are solely responsible for the trading decisions on your account. There is a very high degree of risk involved in trading. Any information and/or content is intended entirely for research, educational and informational purposes only and does not constitute investment or consultation advice or investment strategy. The information is not tailored to the investment needs of any specific person and therefore does not involve a consideration of any of the investment objectives, financial situation or needs of any viewer that may receive it. Kindly also note that past performance is not a reliable indicator of future results. Actual results may differ materially from those anticipated in forward-looking or past performance statements. We assume no liability as to the accuracy or completeness of any of the information and/or content provided herein and the Company cannot be held responsible for any omission, mistake nor for any loss or damage including without limitation to any loss of profit which may arise from reliance on any information supplied by Signal Centre.

FSLR daily bearish hammer at local highOrder SELL FSLR NASDAQ.NMS Stop 139.35 LMT 139.35 will be automatically canceled at 20230401 01:00:00 EST
FSLR daily bearish hammer at local high. This time stop loss goes above monthly resistance area and will run into MA 100.

Crooked W 1.414The W pattern appears to have ended at the 1.414.
Crooked Ws become bearish when the 4th leg ends.
1.414 is the square root of 2.
I can not find the name of this pattern but I am seeing quite a few.
Short for the longer term
No recommendation/price is still above the .236 of the trend up.

RSI DiversionThis one is Skyscraping!
There is a diversion between price and RSI. This will correct at some point.
Price is above the .236.
No recommendation.
Price sits above a long and rickety looking ladder and one could possibly call it a Bull Flag up there.
When this falls, it may fall hard. But the market is still pumping today so who knows?

FSLR daily bearish hammer at all time highFSLR daily bearish hammer at all time high, also end of wave 5. Don't hold over earnings.


FSLR daily bearish hammer at beginning of wave 3 wave 3 downtrenFSLR daily bearish hammer at beginning of wave 3 wave 3 downtrend
Sell Stop 126.60 LMT 126.60 GTC
Buy Limit 112.21 GTC
Buy Stop 134.14 GTC

True Market Leaders: #1 $FSLR👉Name is holding great through the market sell off
👉The RS line up is showing outstanding relative strength
👉Volume indicator we see a bunch of green and blue (bullish) bars highlighted and not much red and purple (bearish).
👉 Stage 2 indicator is showing early turn and key MAs are starting to point up
Not at a buy point yet but definitely a great candidate to watch!

From NVDA to FSLR?My idea is about NASDAQ:NVDA and NASDAQ:FSLR . Two very different companies with respect to market capitalization and products (at least both are semiconductors industries). But there is the funny fact, that - at the moment - the prices for both are about the same and one could trade NVDA for FSLR or vice versa. Momentum for FSLR seems to be stronger than that of NVDA at the moment. NVDA has a lot of head wind - although still a promising future - and FSLR will profit from the Inflation reduction Act and the immediate need to reduce the CO2 footprint in any country of the world. My hypothesis is that NVDA will still suffer for quiet some time and FSLR will continue to improve, but in the long run (2024 and beyond) NVDA will catch up and because of better multiplicative factors such as autonomous cars surpass FSLR in positive momentum.

Anything Above the .236 is a Suspect3 attempts so far to break that high and so far, none were successful. This could change cos everything does.
.I do know folks will ride a high. But not forever.
For those who are looking to invest longer term, this may not be the one for you.
The party will end.
Securities even above the .382 fib level, much less the .236 fib level, would be risky to me if I were looking longer term. This one is above the .236.
When panic sets in, buyers become sellers.
Just an opinion and everyone has one.
I use the Covid low to do my Fib levels. You may not. That is the bad thing about fib levels as we can often see different starting points for the fib table.
You know this just chart just looks risky! I do not think anyone would argue that but I am not saying it will not make a new high. It might. Just be careful is all.
It may Not just be that the economy is eating Rock Soup. The fast and furious rush that ensued after the Covid bottom could be contributing to the demise of this market.
No recommendation.
When someone's wallet is cramping, they do not give a flying F about solar, utilities or healthcare. They will sell. They only need to be pushed to the limit, then they will let go.
The final score does not always tell the story of the game.

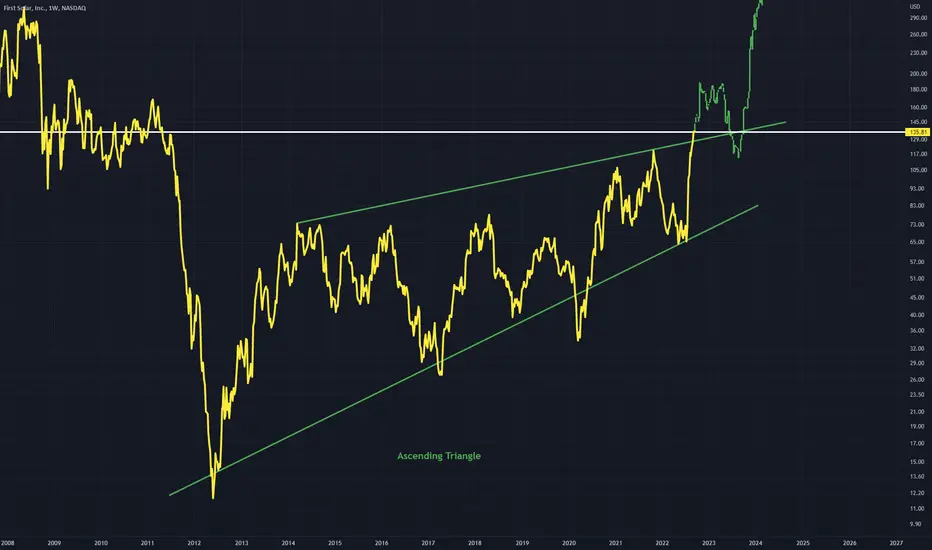
FSLR - Ascending Triangle Breakout A large ascending triangle has formed on FSLR
Ascending triangles usually break out bullishly
I expect a retest of the upper trend line post breakout (white line)
Following this price can moon
First Solar: Impressive relative strengthFirst Solar does not care. What correction? When market eventually turns higher, this stock is likely going to lead the charge out of the gates.
FSLR Daily Technical AnalysisFSLR Daily Technical Analysis
Resistance price: 139,91
Support Price: 121,91 - 111,20 - 102,12
We added this stock from 127,03 price early time. Four days ago daily technical started show NEGATIV and 3 days volatility started down. Losting power. Until 77,50 has space of technical graphic. Middle term price need close this.

time to follow QQQ's (down)FSLR generally tracks closely to QQQ's, and recent divergence is temporary in my opinion
While its possible that the QQQ's break to the upside and exit their bear market, the more likely scenario is for the recent bear market bounce to fizzle out and we'll at least see a re-test of June lows.
repeat of June 03-16 would be 17% decline for FSLR --which puts it at ~$112. QQQ's only lost 12% in that time frame, but note that the low average daily trade volume for FSLR contributes to its price volatility both directions
here is a quick comparison I did of volume activity of FLSR vs a couple of its peers:
First Solar, Inc. (FSLR)
MCap 14.7B
Avg. Volume (10) 3.91M
Avg. Vol x price = 537,742,300 (0.37% of MCap)
10.69% of Shares Held by All Insider
82.20% of Shares Held by Institutions
Sunrun Inc. (RUN)
MCap 8.09B
Avg. Volume (10) 6.02M
Avg. Vol x price = 228,783,400 (2.82% of MCap)
5.90% of Shares Held by All Insider
95.03% of Shares Held by Institutions
SunPower Corporation (SPWR)
MCap 4.83B
Avg. Volume (10) 3.559M
Avg. Vol x price = 98,904,610 (2.04% of MCap)
51.3% of Shares Held by All Insider
39.41% of Shares Held by Institutions

FSLR-SELL +++We have moved north for a long time, and its hard to understand the time staying this high.
However, the medium-term picture always remained objective near 92.00-94.00, based on false bull flag pattern and a lofty MACD and RSI. The daily RSI is turning below its average.
Strategy SELL between 120-140 for a move to 95.00 profit objective,

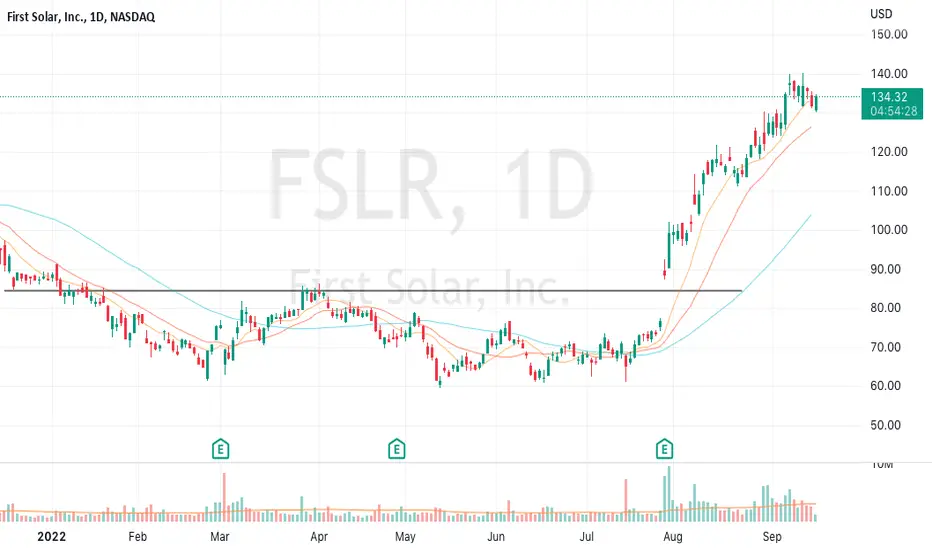
9/11/22 FSLRFirst Solar, Inc. ( NASDAQ:FSLR )
Sector: Electronic Technology (Semiconductors)
Current Price: $135.82
Breakout price trigger: $138.40
Buy Zone (Top/Bottom Range): $131.00-$122.00
Price Target: $144.00-$145.90
Estimated Duration to Target: 40-43d
Contract of Interest: $FSLR 10/21/22 150c
Trade price as of publish date: $4.60/contract
