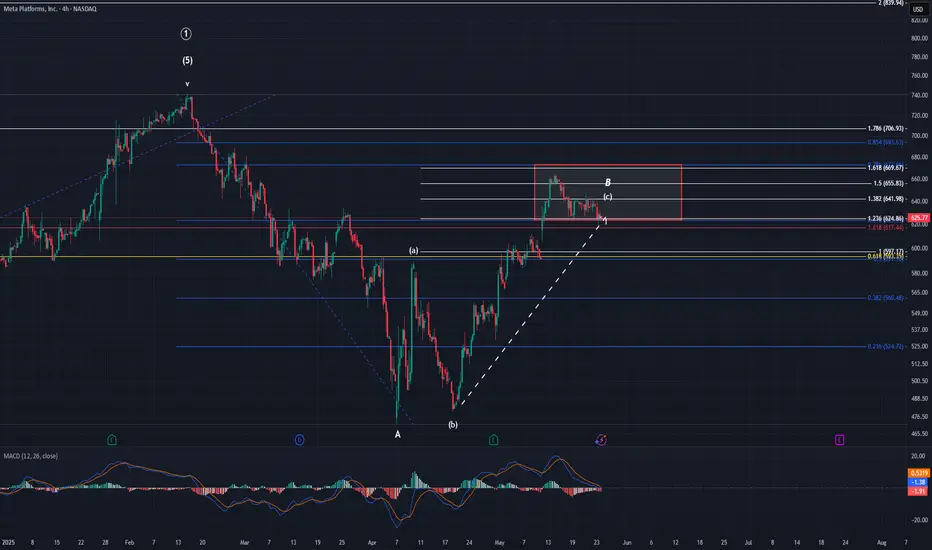
MetaSo far Meta has been following the analysis very nicely. Price came up just short of the 1.618 extension and the 0.786 retracement fib of A. Since then, it has started to move lower and poked below the target box. We could technically get another poke higher to tag the 1.618 but it isn't required. We do have hidden bearish divergence on MACD as you see MACD made a higher high, but price did not. If we can start to get some overlap lower as well as breach the 1.0 @ $597.17, that will be a good sign that the top is in fact in.
If we have topped, we should be looking to the $420-$320 area for the completion of minor C wave. Minor C should take around 2 months or so to complete if it is to follow the lead of A & B. I feel this is all pretty straight forward so I will leave it at that. Please let me know if you have any questions.
FB2A trade ideas
This #1 Indicator Is Like A Voting SystemEmotions are very important to look out for.
In the past week i have been sad and i dont know why
But even though that has been the case, i decided to do
some good old fashioned manual labour
not heavy work just light work good enough
to change my mood.
Think of these indicators as tools
to help you read the crowd behaviour.
This price pattern shows you the rocket booster
strategy.But one thing you have to notice.
Notice the new indicator included below?
That indicator is called the ADX indicator.
Now the Rocket booster strategy
Has three steps.Its on the number 3 step
that you will see the power of the ADX indicator.
Crowds have emotions.
This indicator shows you whether
the major crowd is buying or selling.
Think of this indicator as a voting system.
This will help you understand the importance of
the last step in the Rocket booster strategy.
As you can see NASDAQ:META is in an uptrend
this shows you the #1 Stock leading in
the NASDAQ tech market.
To learn more about the rocket booster strategy
Rocket boost this content.
Rocket boost this content to learn more.
Disclaimer:Trading is risky please use a simulation
trading account before you start trading with real money.
Also learn risk management and profit taking strategies.

META wait for retest and hold down for short swingsMETA 4hr under 9/21 ema and Daily under 9 ema. can wait for a retest of previous s/r flip spot 637.3 then shorts for better r/r downwards to 611.2 target


MetaverseNASDAQ:META looks ready to go, forming a flag, inside week as of May 22, not much volume above to resist a push, holding the 9 EMA, a deeper pullback to 21 EMA would be a good buy point for leaps
targets: 650, 675, 700 (psychological numbers)

META watch $545-549: Resistance to End Bounce unless strong BullMETA struggling with anti-trust case and AI spend factors.
Currently up against a key Resistance zone $545.51-549.38
If it dips then watch solo fib at 532.20 or zone 504.44-508.71
.
Previous Analysis calling $489 as possible bottom:
"Genesis Sequence" that has caught every major turn:
===========================================================

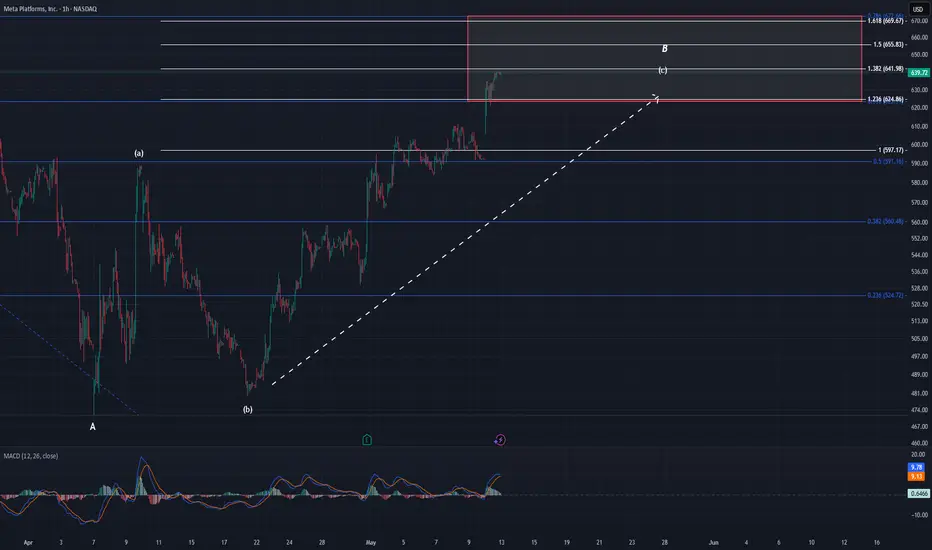
Meta UpdateWe're still within the target box thus far. Price came about $5 from the 1.618 and began to move lower. We cannot yet determine if the top is in, but I believe it is close if it isn't yet.
If a top is not in, then I think we make a slight high to tag the 1.618 / 0.786 in the $670 area. If it is in, then we have begun our descent to the $420 - $318 area. I know that is a very big zone, however, we're very early in the pattern if we are in fact headed lower. Once we get more data I can refine this target. All I can go on at this point, though, is the fibs from the larger minor A-B waves.
Looking at MACD, you can see we made this high on bearish divergence. This doesn't bode well with continuation higher. Normally, you need a healthier pattern / technicals to support continued momentum higher.
In short, I believe we begin to move lower again in the near future if we haven't already. Minor C will take time though. So don't read this and think I am saying next week C will be done, because that isn't gonna happen. These things take time.

Long Trade Opportunity Targeting $673.80 Upside Direction: LONG
Targets:
- T1 = $660.50
- T2 = $673.80
Stop Levels:
- S1 = $628.00
- S2 = $615.50
**Wisdom of Professional Traders:**
This analysis synthesizes insights from thousands of professional traders and market experts, leveraging collective intelligence to identify high-probability trade setups. The wisdom of crowds principle suggests that aggregated market perspectives from experienced professionals often outperform individual forecasts, reducing cognitive biases and highlighting consensus opportunities in Meta.
**Key Insights:**
Meta continues to show resilience in a volatile market, driven by its strong quarterly earnings, robust user growth, and strategic expansion into cutting-edge AI technologies such as generative AI. This positions the company favorably for future growth, making its stock highly attractive to long-term investors. Sentiment around Meta remains broadly positive, with analysts projecting substantial upside as institutional investors accumulate positions. Analysts note that Meta's investments in monetizing its platforms, especially in artificial intelligence and virtual reality, could unlock significant future revenue streams.
**Recent Performance:**
Meta's stock price has been in a consistent uptrend, gaining over 8% in the last month. Trading volumes support this bullish movement, reflecting growing institutional interest. The stock has rebounded strongly from prior correction levels, exhibiting steady accumulation patterns. Furthermore, its daily and weekly charts signal strong upward momentum amid market stabilization.
**Expert Analysis:**
Several analysts have upgraded their Meta ratings recently, emphasizing its long-term potential to sustain high revenue growth rates. The company's focus on strategic growth avenues—expanding market reach in developing economies and exploring advanced technology trends—continues to attract a mix of retail and institutional investors. Meta's advanced monetization ability in areas such as virtual reality and AI further reinforces its growth narrative. Technical indicators are bullish, with RSI and MACD pointing towards continued short-term strength.
**News Impact:**
Recent developments in generative AI have fueled optimism around Meta's future. Key announcements include technological advancements tied to AI capabilities and regulatory clarity around technical advertising practices. Additionally, growing traction in emerging markets has heightened its potential for long-term success. These news items have instilled confidence in traders, leading to increased market activity and bullish sentiment regarding Meta.
**Trading Recommendation:**
Based on technical patterns, recent performance, and expert analysis, a long strategy on Meta is recommended. The bullish momentum and optimistic market outlook make this an attractive opportunity. A clear stop-loss strategy is defined to mitigate risk, while targets above current price levels reflect realistic expectations based on consensus forecasts. Traders should capitalize on Meta's robust growth trajectory and market-leading position.

META - Another great earnings, allowing us to collect value?Hi guys ,we would be looking into our analysis for META stock.
Meta Platforms Inc. has demonstrated robust financial performance, underscoring its strategic investments in artificial intelligence (AI) and digital advertising.
Strong Financial Performance
In Q4 2024, Meta reported revenue of $48.39 billion, marking a 21% increase year-over-year. Net income surged by 49% to $20.84 billion, with diluted earnings per share (EPS) rising 50% to $8.02. The company's operating margin improved to 48%, up from 41% the previous year, reflecting enhanced operational efficiency.
AI-Driven Advertising Growth
Meta's advancements in AI have significantly bolstered its advertising capabilities. In Q3 2024, advertising revenue grew by 18.6% year-over-year, reaching $39.89 billion. The integration of AI technologies has enhanced ad targeting and delivery, contributing to this growth.
Our Confidence
Overall analysis maintains a bullish outlook on Meta's stock, with an average price target of approximately $634, suggesting a potential upside of around 17% from current levels. The company's strategic focus on AI and its strong financial results support this positive sentiment.
In summary, Meta's strong earnings report, driven by AI advancements and advertising growth, positions the company favorably for continued success in the evolving digital landscape.
📌 Trade Plan
📈 Entry: 550
✅ Target: 630 - below the ATH to give an achievable destination
❌ SL: 480 - below the support zone to protect the trade

Meta Bull Rally Not OverBullish trend line still intact, meta ready to rocket ship up, predicted move above 670-740

"MASTER OF SOCIAL REALMS, META" How Does Meta Make Money?The long-term outlook for META stock looks pretty promising. Thanks to heavy investments in AI and the metaverse, along with steady growth in its advertising business, analysts predict the stock price could climb from its current level (around $640) to anywhere between $700 and even $2,000 by 2030. AI-driven improvements in ad efficiency and growing user engagement on platforms like Facebook and Instagram are major drivers. Plus, the company’s solid financials give it plenty of room to keep investing in the future.
That said, there are risks to watch out for, like tougher regulations in Europe, increasing competition, and uncertainty around the metaverse’s success. Overall, though, META’s strong position in tech and the market makes it a solid pick for long-term investors. Just make sure to weigh those risks before jumping in.

Going to mid 500 the signs are there Getting stronger of the bearish sentiment as i closes on 700 for the second time, with OB OSC. technical indicators slowing, could take some time and could get choppy but learning it's happening.
META PUTS IN THE MORNINGHere is META currently rejecting the supply zone around 660.60. If price returns anywhere within the RED Zone tomorrow I will entering. If it Wicks at OPEN ill be entering heavy.

META Pullback or Correction? Let’s Talk.
Back in January 2025, META printed what looked like a top… but if you zoom out and analyze the structure, you’ll notice this wasn’t a true correction — just a healthy pullback.
✅ Price never broke critical structure
✅ Buyers stepped in at the 0.5–0.618 zone
✅ Current candle strength suggests bulls still in control
This isn’t random. It’s structure. And structure tells me that META is gearing up for a potential new high — especially if we clear the Jan '25 zone around 740.
Not financial advice, just what the charts are saying 🔍📊

Meta UpdateNot a whole lot to add to my Meta analysis. I have been calling for this move higher for about 3 weeks now. Today we finally found out what the catalyst was to spark the move higher. As I have said multiple times in the past, I don't really care so much about the why. The thing I care about is the where. Where will price go?
Price came just shy of the 1.382 today and has enough waves in place to be considered complete. It also has created bearish divergence on MACD. These things don't mean a top is in by any means. They point to a top being in the works. I'm sure me saying this on the day META jumps almost $50 and 8% doesn't sit the best with some. To those people, I say, good luck. As always, you should trade your own convictions. Just remember, when price begins to head lower in the days / weeks to come, you heard it from me first.
Meta Platforms (META) 4H Outlook – May 2025Following a liquidity sweep and several confirmed Breaks of Structure (BoS), META has shown a bullish market shift. Price is currently hovering near $592.49 after a strong rally.
There is a clearly defined demand zone around the $555–$570 area (highlighted in green). If price retraces to this zone and holds, it could act as a launchpad for a continuation move toward the $636.95 target, aligned with a previous structural high and potential supply.
The setup reflects strong smart money behavior—monitor price reaction at the demand zone for bullish confirmation before engaging.

META: Exponential Scaling PI^0.1Meta Platforms, Inc. has been on a meteoric rise, recently surpassing $700, and its price action suggests a strong adherence to exponential growth patterns rather than linear trends. Traditional charting methods often fail to capture the real movement of high-growth stocks, making the Exponential Grid indicator, which applies non-linear scaling using a constant of Pi and an exponent of 0.1, a valuable tool for traders and investors. This approach highlights key exponential support and resistance levels, which the stock has consistently respected over the years. After a significant downturn in 2022, META rebounded impressively, breaking through critical resistance in the $500-$600 range, and now faces its next potential hurdle around $750-$775. The exponential scaling framework helps to identify price zones where reactions are likely, offering better risk-reward assessments, improved stop-loss placements, and more accurate price targets compared to linear scaling. As META continues its parabolic ascent, the next move depends on whether it can sustain momentum above exponential resistance, potentially pushing it into uncharted territory, or whether a pullback to lower exponential supports occurs. With technology stocks often following logarithmic or exponential growth curves, tools like the Exponential Grid are becoming essential for trading dynamic and volatile markets effectively. Understanding these patterns is not just a technical advantage but a crucial edge in navigating today’s ever-evolving stock market landscape.

meta upward trendline break comparison side by sidemeta has 2 identical trendline breaks side by side on the hourly (and 4 hour chart). very good to compare and contrast. both have double tops at resistance but one of the differences is that the successful break (on the left) had price under the 9 and 21 EMAs while the unsuccessful one (to the right) didnt, within many other differences.

Meta - can buy or not ?Looking from weekly chart, we are up 2 weeks consecutively!
A nice ABCD pattern has been completed and price is now consolidating at the resistance level of 602.66. Note there is a small gap up on 30 Apr.
How will price moves from here ?
1. It moves down to close the gap and then continue the run up
2. It breaks above the resistance level and run up
You can park 5% at option 1 as it is difficult to know in short term how the price action will move.
Then, if the price goes to option 2, you can add more, ie 10-15% .
Both options are on the basis you bought into the fundamentals and growth story of this company. If you are trading for short term, then it is a different story. Price has already rebounded 50+% from the bottom, meaning you probably have missed the boat to go LONG around 480-520 price level.
It also depends how long you want to hold this stock for , is it a day , a week or months? The longer your time frame, the lesser precise you need to be in your entry. Don't lose sleep if you did not catch it at the ultra bottom, very few can (they are more lucky than skilful )
As usual, this is not financial advice and please DYODD


Meta - The Correction Is Officially Over!Meta ( NASDAQ:META ) is retesting the previous all time high:
Click chart above to see the detailed analysis👆🏻
For more than 7 years, Meta has been perfectly trading in a reverse triangle formation. And just three months ago, Meta once again retested the upper resistance trendline and reversed towards the downside. But with the retest of the previous all time high, this correction is over.
Levels to watch: $500, $800
Keep your long term vision,
Philip (BasicTrading)

META (Facebook) | Long Setup | Strong Earnings | (May 2025)META (Facebook) | Long Setup | Strong Earnings & Growth Outlook | (May 2025)
1️⃣ Insight Summary
META has been in a correction since February, coinciding with macro shifts like Trump’s re-election. However, recent earnings and long-term financial projections point to renewed strength.
2️⃣ Trade Parameters
Bias: Long
Entry Zone: Around $550
Stop Loss: $476
TP1: $625
TP2: $680
TP3: $739
Final Target (Stretch Goal): $905
Partial Exits: TP1 and TP2 will secure gains early, while the rest rides momentum toward higher levels.
3️⃣ Key Notes
📈 META reported strong earnings recently, and forward guidance through 2028 looks bullish—both EPS and revenue are projected to rise.
💡 Financially, it’s solid:
• Revenue: $165B
• Net Income: $62B
• Free Cash Flow: $50B
• Debt: ~$50B
• Beta: 0.32 (less volatile than the market)
✅ Healthy cash flow and growth outlook make META attractive long-term.
📊 Technically, we're at a resistance area, and the setup aligns with broader S&P 500 structure. Waiting for a clean confirmation around $550 will be key.
4️⃣ Follow-up Note
Watching closely for a breakout above resistance or potential retest of the $550 zone for entry. Will update the idea if price structure changes significantly.
Please LIKE 👍, FOLLOW ✅, SHARE 🙌 and COMMENT ✍ if you enjoy this idea! Also share your ideas and charts in the comments section below! This is the best way to keep it relevant, support us, keep the content here free and allow the idea to reach as many people as possible.
Disclaimer: This is not financial advice. Always conduct your own research. This content may include enhancements made using AI.

This is a fragile recovery within a technically damaged chartMeta Platforms Inc. (META) — Technical Analysis
Timeframe: 1-Hour
Current Price: $546.45
Trend Bias: Intermediate-term Bearish, Short-term Reversal Attempt
Price Action & Structure
Downtrend from March to mid-April:
META has been in a clear and sustained downtrend, characterized by lower highs and lower lows. Price consistently failed to break above prior resistance levels, confirming seller dominance.
Capitulation & Bounce (mid-April):
The sell-off intensified into mid-April, where META appears to have formed a temporary bottom around $485–$490, aligning closely with a support zone (marked by the red line at $479.76).
Recent Recovery:
The stock has since shown signs of short-term strength, bouncing approximately 12% off the April lows. However, this move currently resembles a bear market rally rather than a true trend reversal.
Key Levels
Resistance:
$582.60 (Pre) – Historical pivot level; potential rejection zone.
$613.73 – Structural resistance and supply zone. Confluence with prior breakdown point.
$641.63 – $657.80 – Major resistance range. Represents previous distribution zone and failed breakout area.
Support:
$546.00 (Current level) – Price is hovering just above minor structure but remains vulnerable.
$479.76 – Last-ditch structural support; breakdown below opens risk to lower $400s.
Volume spike near the “E” suggests earnings reaction was a key turning point — important to monitor how price holds above this level.
Volume & Momentum
Volume Profile:
Increased volume at the recent low suggests capitulation or accumulation. This could mark the early stage of a base, but it’s too soon to confirm.
Momentum Indicators (Not visible here but assumed):
Typically, RSI/MACD would now be recovering from oversold. However, given the context, momentum is likely neutral-to-slightly-bullish but fragile.
Technical Outlook
Short-term:
META is attempting to recover within a broader downtrend. Watch for price action around $560–$582. If it rejects and turns lower, that would confirm the bear flag or rising wedge pattern.
Medium-term:
The stock must reclaim and hold above $582.60 to gain serious traction. Otherwise, this bounce may serve as a dead cat rally before another leg down.
Long-term Investors:
Wait for either:
A successful breakout above $613.73 with strong volume and follow-through, or
A flush toward $479.76 followed by a clear reversal pattern (e.g., double bottom, bullish engulfing).
Analyst’s Summary
This is a fragile recovery within a technically damaged chart. META must prove this bounce is real by retesting and holding higher levels. Otherwise, sellers remain in control. Patience and discipline are key here.
