Salesforce.comFundamental:
Salesforce acquires Slack for $27.7B, making the biggest acquisition in its 21-year history.
Technicals:
Price action broke through a HTFZ at the high end of the curve. I'm anticipating a drop in price between the $147 - $165 levels. We shall see...
FOO trade ideas

$CRM GO TO THE DOWNA lot of analysts are starting to give the company downside signals - be careful in all cases - this is just a nudge


022. PIGGISH PLAY - LONG Digital Turbine + CRM Earnings StrangleEver wonder what it would be like to have your cake, and eat it too?
Go ask Paylocity - it's the biggest mooch on the street.
Why am I starting with the optional/bonus part of this position?
It is because:
1) APPS technicals are so profoundly bullish that I may just avoid mentioning them entirely in this description, and
2) It's pretty damn funny to observe how parasitic Paylocity's stock price is when it poaches CRM's much-needed volume - only to cut all ties a few hours later, leaving the premises without waking CRM up in the morning.
Anywho, I think we might just have a very affordable, synergistic means of playing CRM's earnings report on Tuesday using Paylocity calls, APPS calls, and CRM puts. If CRM smokes its estimates, Paylocity will most definitely skyrocket given its latest performance and APPS will rip higher if it can hold that unbelievably steep lower trendline.
Seriously - this sort of consolidation is extremely rare for such a young company. It reminds me of how Tesla and Shopify used to be - before fundamentals were discarded for Stocktwit sentiment indicators - except that APPS's early stages seem even bullish-er.
Don't believe me?
Take a look at how both of these monsters grew up around 40 bucks/share and compare them against the top chart. APPS has them beat in every category; particularly its incredible rate of consolidation and ability to recover 4-5 points higher on any given day. While Tesla can do this on a much bigger scale now, it took them forever to get to this point. This stock can do the same damn thing and it's only at 40.
Onto the Pig Play Details:
This is an Options-Only play that allows more risk to be taken because of the offsetting positions. If you want to buy and hold equity, go right ahead but I don't have an offsetting solution for you that would be worth the risk in this spot.
If Monday is choppy and slightly red, wait until the end of the day to enter all three positions simultaneously. There is zero reason to take on the additional risk for some sort of premium scalp if ZM catches a bid before it reports - or something like that.
On the other hand, if it is an insanely bullish day from the start because USD Monopoly Money is recognized as somewhat fraudulent by all of the countries that have been blindly buying our notes, then I'd recommend focusing on entering the APPS calls first and foremost, right on the button.
Now time for the Pig-Specs:
ALTERNATIVE 1: LONG BULL WITH SIMPLE OFFSET (APPS CALLS, IWM PUTS):
APPS (CALLS) - BUY - (45 Dollar Strike, 12/18/2020 Expiration)
IWM (PUTS) - Use about 1/3rd of the capital used to purchase the APPS calls and buy the second strike behind the then-current price and a 12/04 expiration. If you don't like wasting money, I suggest you
ALTERNATIVE 2: LONG COMPLEX SOFTWARE ER STRANGLE WITH (APPS CALLS, CRM PUTS, and PCTY CALLS):
1) APPS (CALLS ) - (same as above), you get to choose how many you want to buy since you are autonomous (unlike Paylocity). Just know that the net cost of the other two positions should roughly equal 75% of the amount allocated to this main long call position.
2) CRM (PUTS) - BUY - (1-2 PUTS, NEAR THE MONEY, EXP 12/04/2020 Expiration)
While these are both stupidly expensive and unlikely to hit, it is a NECESSARY part of this play. You are getting a severe discount on the relatively large number of calls that you wouldn't otherwise receive under 99% of circumstances. The overwhelming odds are that CRM beats and that the market will not tank until the NAS touches new highs. However, pay the premium so that you're hedged all day and avoid getting cute by waiting two hours for a discount.
Naht in this market and don't come crying to anyone if ya go forward unhedged.
3) PCTY (CALLS) - BUY - (220 Strike, 12/18/2020 Expiration)
Allocate 1/3rd of the amount of capital that you just spent on your offsetting CRM puts and purchase these unbelievably beautiful-looking calls that have a ton of implied volatility that will kick up the second CRM reports, a very nice amount of theta to work with, and a strike that can be very easily surpassed this week. Both these calls and the APPS calls are amongst the best deals I've seen all year.
Good Luck Ya Software Nerds.
- Software Appigation Strangler
NASDAQ:APPS
NYSE:CRM
NASDAQ:PCTY
AMEX:IWM


CRM Buy Set UpIts dropping fast now. but I am seeing a reversal very soon base on my analysis. A good time to go LONG.

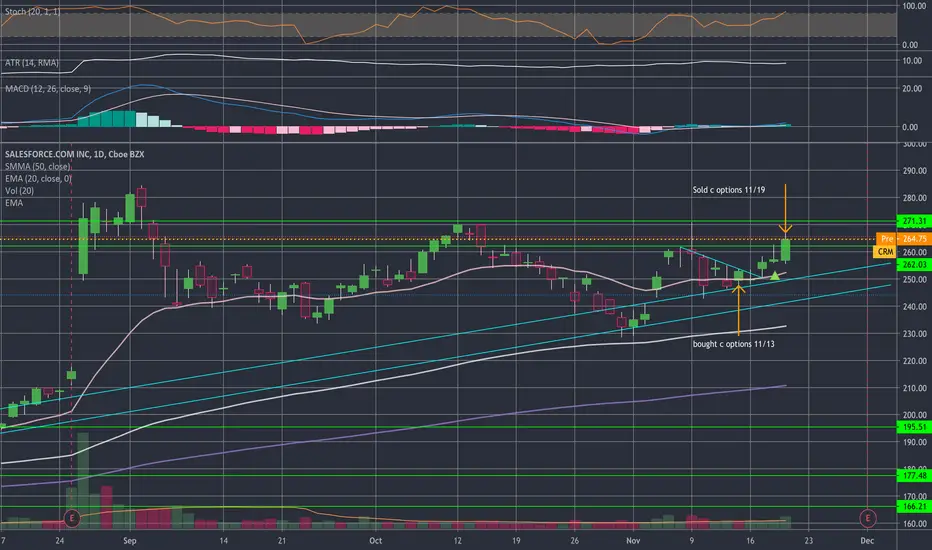
Salesforce Pre-Earnings BuyHello Traders!
Salesforce earnings are on its way Dec. 1st.
I feel as though CRM still has room to run towards my two entry points.
Entry #1: I don't want to miss the bullish run so I have a riskier entry here.
Entry #2: This entry will be if I decide to take a less riskier approach if I don't feel like the odds are in my favor at the open.
CRM is approaching the oversold on the RSI so I am waiting to see bearish weakness. Patience its not there yet.
My first price tsrget will be a test of the 50EMA. Then the resistance level at $270. I will be selling my contracts should I decide to enter before earnings are announced.
DISCLAIMER: I am not a financial advisor and all charts posted are for educational purposes only.

Watchlist Breakdown & Trade IdeasWatchlist Breakdown and Trade Ideas
- AAPL
- AMZN
- ZM
- CRM
- Slack
- AMD

CRM - November 29, 2020CRM has engaged in advanced acquisition talks with Slack (WORK) as a strategic defense to increasing competition from Microsoft and Google. Since the news, WORK has soared 39.45% while CRM is down 3.75%. Coming off of a 115% earnings beat last quarter, and current analysts median price targets at 285 (implying 15% upside from Friday close) look for movement early in the week ahead of the earnings release Tuesday AMC.

$CRM Bullish Trade PlanGreen Line - Entry Target
Red Line - Exit Target
Pink Line - Stop-Loss
Highly suggest using Google to Search "Transparent Traders" if you're trying to get to the next level.
Transparent Traders exists to solve the critical issues facing our traders, both large and small. Our unique approach is not only what differentiates us, but also what makes us successful.
Our advanced Blackbox uses custom algorithms & predictive A.I. to locate the most accurate day or swing trades for the best chance of success.


CRM - Let's go Some ideas around how CRM could move over the next couple of weeks. Show some support (like) if you agree :)
CRM Signals to go Long:
1) 1 solid breakout confirmation candles out of the wedge formed
2) RSI starting to trend (>50)
3) MACD crossed (3-5 candles back)
Entry : 260+
Exit : 285 or ATH

Iron TariHi guys,
just as described in my strategy we have 4weeks 13% strikes.
The maths are simple, just have a look at the strategy, and all the iron conodrs I shared in "ideas".
Enjoy your wallet!
Tari.

$CRM - earnings optionsI already cashed in on $CRM options and plan to do it again before earnings.
Buy the open on the 23rd or end of day the 25th (option cheapest on Wed and Fri at close) and sell at the close on the 30th of Nov

$CRM - taking another day of gainsPlan is to buy the open, sell by 1pm ET. Not holding over the weekend

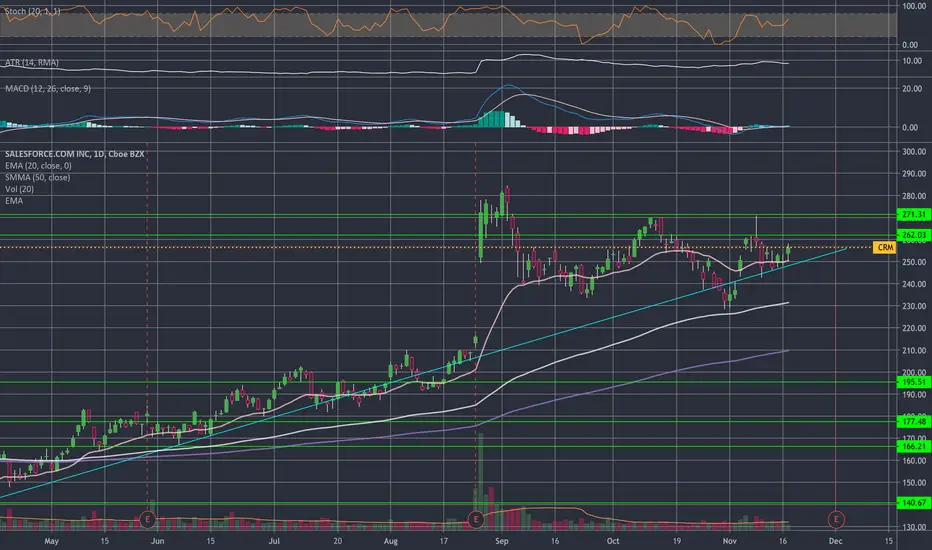
Salesforce Brakeout NYSE:CRM
Salesforce brakes out of 2,5 month flag pattern supported through upward trendline.
EMA20/50 and SMA200 indicate stable primary and secondary upward trend.
MACD turns positive and indicates strengthening tertiary upward trend.
CRV = 2,83 / Stop Loss at 0.236 FIB / Take Profit at 1.23 FIB

Is SalesForce making a highHello Traders, SalesForce is a nice sell because it's hitting a large volume of sell orders right now. A good candle information at the big order zone will be the trigger for the sell. I will be posting updates if necessary. Thank you.

$CRM - ride into the customer management system of my dreams I like $CRM for call option picked up a $250 call a couple of days ago with target above $262 and reevaluate if we hold up to the $270 resistance.
Expiry: 1/15/2021
CRM Round UpCRM is holding currently at the moving averages. The moving averages are acting as support and are all converging. I'm looking for this to hold above these averages and begin it upward trend back to the top of the range to compete its rounding formation.

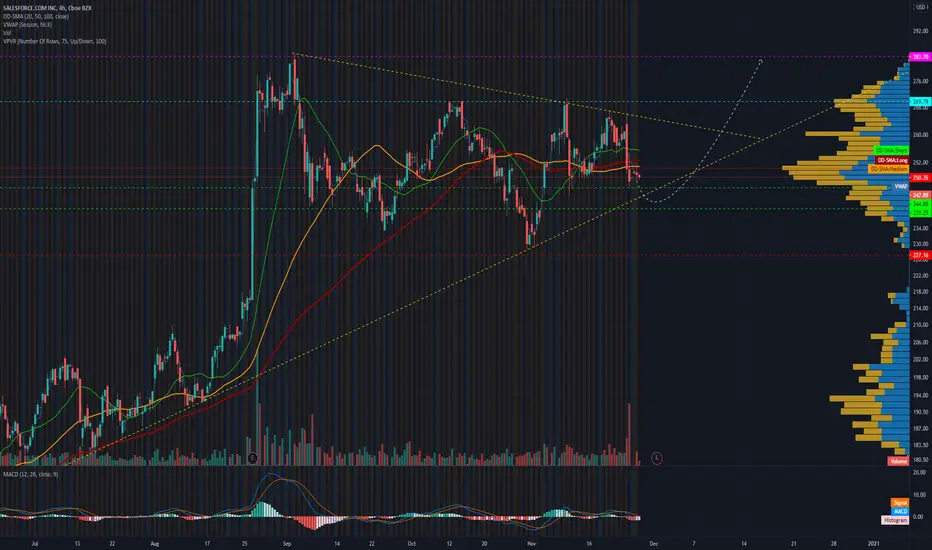
How to use Corrective Structures to develop a SetupGreat day to learn something, today; we will understand how to use corrective structures to develop a setup on any chart.
a) There are 3 types of Corrective Structures, Zig-Zag (first example), Flat (Second Example), Triangles (third example). Use them as an archetype to spot them on a chart.
b) Now that you understand the types of corrective structures is time to look at one on the chart ( you can see a Flag Pattern on the real chart)
c) Should I trade all the corrective structures I see? NO, YOU DONT! You need Context. Your corrective structure must be well-positioned on the chart, it can be a Trendline, or it can be a Support. Never trade isolated patterns.
d) Then you need a clear path in the direction you are expecting. In this case, we are at All-time Highs, so we don't have any Resistance
e) How can I calculate my target? Use Fibonacci Extensions. Draw it from the base of the impulse towards its top (where the corrective structure starts) and then take it back to the impulse's bottom. Pay attention to 2 levels only 1.27 for Break Even, and 1.618 for Target
f) Only take setups with a risk-reward ratio higher than 1.5
Have a Great Day!!!
