FPMB trade ideas

The Direction of FREEPORT- MCMORANHello traders, FREEPORT- MCMORAN is in a bullish push, breakage of the compression zone to come up, possibility of breakout of the stabilization zone.
Please LIKE & FOLLOW, thank you!


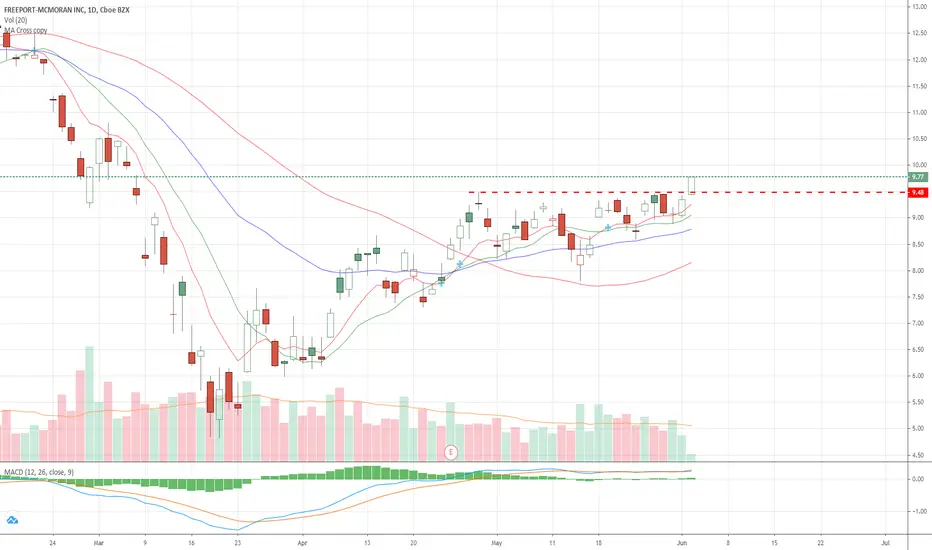
Nice Swing/Position EntryLooks like a good place to enter withe the crossing of the 200ems, the rest of the ema's moving upward, and the macd crossing.

FCX Long IdeaFCX is breaking out this morning to new near term highs. Its price is above the supporting moving averages. I'll take this trade.
FCX Apr29 to May12 Bear-Flag formation - Short SellBetween April 29th and May 12 a clear short term bear flag appears to be forming. Long term there appears to be an underlying bullish symmetrical triangle that began forming back in Feb 2020. This underlying bullish triangle would normally be of concern, yet the SPY has a similar formation which is a long term Bear Flag that began forming in February and as of May12, it appears the SPY is ready for a correction (follow through) with the longer term bearish pattern since the lower support has broken.
Thus, the short term (Apr29 to May12) Bear Flag that is forming in FCX should be valid. Risk to reward is at approx. 23% on the downward move and 4% on an upward move. I like those odds. I bought 120 June5 puts at a strike of $8; I plan on exiting 1/2 of my position if/when the underlying FCX stock reaches my target of 8.23 and empty the rest of my position at 7.38 to close my position.
At, or around, 7.38 I plan on going long to take advantage of the dead cat bounce... On the chart you may notice an "M" formation forming... 7.38 would be the bottom of the last leg of the "M". I expect the stock to bounce to around 8:40 and then return on it's journey southward to test it's 3 month low of 4.88. I plan on swing trading this to the bottom to increase profit margin on the plan. When the stock reaches 8.40 after it's dead cat bounce, I plan on re-entering into a put position with an expiry of Jul20. Initial investment $2540.00.... First leg expected profit $9500.00.... dead cat bounce expected profit $2500... expected long drop to test the 4.88 low profit $14,000.00...
I will update this post as the game plan plays out.
*** This is not investment advise and is only for analysis purposes. I am a novice and am posting this for critical feedback to make sure my strategy is sound.

SELL-BUY-SELL StrategyRecent new release from several outlets upgraded FCX to a weak BUY on 4/27, Company missed earnings largely due to COVID19, Company shuffling finances around quickly to shore up losses along with fur-low's and layoffs, outlook for 2020 bleak but hopeful. Copper prices rally'd yesterday with an expected pause in it's rally today or tomorrow for a sell off in the commodity. FCX's Gold holdings are weak and production less than desirable to make the company profitable. Company is not profitable at this time and has lost much of it's equity due to loss of income. Long Term reentry into the stock @5.55 to 6.03.
My current strategy for me is to look for an exit of my 9.5 short position when the stock is between 7.85 and 8.33; then quietly wait for the short squeeze to complete this week. Potential reentry into a SHORT position when the stock retests its 9 and 9.48 R levels. Final exit from my short position at a target range of 6.03 to 6.44. This is not advice to purchase, sell, or acquire equity's in FCX - This is all based upon my analysis of the market, the company and it's 30 day outlook through May.

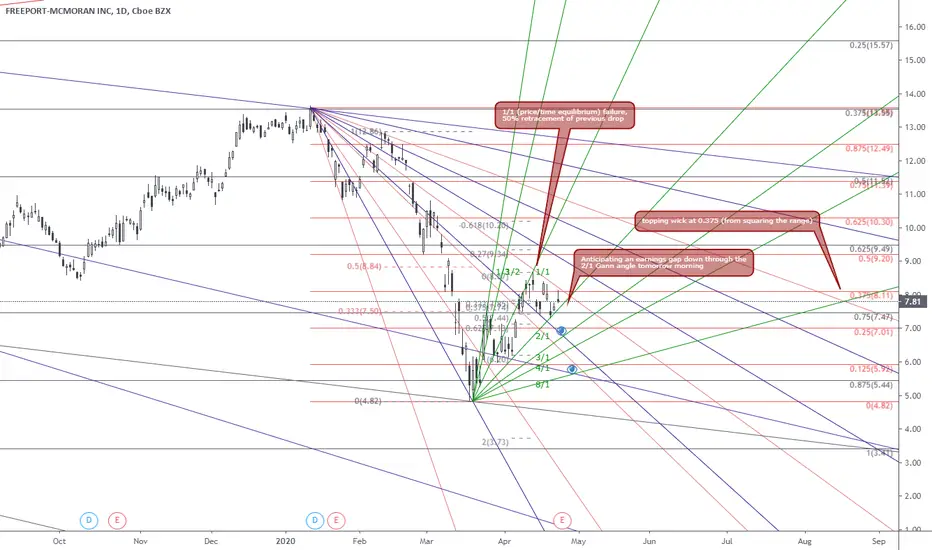
FCX shortEarnings report tomorrow morning. Should be pretty abysmal....covid, copper not doing so hot, revenue should be down with mine closures and low consumption/need for copper. Took some put positions EOD today. Lets see what happens. Technical rationale on the chart.
The "eyes" are my potential targets for tomorrow.
Questions/comments welcome.
Full send or no send.
Bearish Triangle on Copper StockFreeport-McMoRan is one of the most actively traded natural-resource stocks. The copper producer has lost about half its value amid the coronavirus selloff, and now the chart may be setting up for further downside.
This pattern is a straightforward bearish descending triangle. Support has been around $6.15 since the market bounced last week, but FCX has made lower highs since then. Sellers may get active on a break of $6.15 and look for the downtrend to continue.
FCX also has a big debt load, which can weigh on prices when the economy and credit markets are weak. Macro conditions like this are negative for industrial metals like copper .

FCX $3.75 on The WayThis is ONLY for Long Term Investors - FCX heading to $3.75 as always do your own DD

FCX prepare to Long At weekly demand zone Condition: if SPY will go up next Monday morning.
Confirmation Entry: Stop/market buy: above 5.75 and below 5.95
Stop: 5.30
Target:8.00
Risk/reward=1:3
This is a trading school homework. I need 6 months to practice my trading plan.
If you like it, thank you for your support. Please use SIM/Demo account to try it, until my trading plans get high winning rate.
Sum of my ideas: 1 winner, 1 loser, 1 active, 7 cancelled, 1 pending for condition, 1 analysis only.

FCX A GREAT GREAT Value Buy At $3.75 This name if it can get back to $3.75 or $3.50 (and I think it will ) is a GREAT LT hold with a potential 500% upside - as always do your own DD

OPENING: FCX MARCH 20TH 12 SHORT PUT... for a .57 credit.
Notes: High rank/implied with earnings. Going with a Plain Jane Wheel of Fortune short put here, as I did with BBBY. (See Post Below). Break even/cost basis in shares at 11.43.

Copper demand from China will be robust after COVID-19. Buy FCX?Freeport McMoRan is the largest global supplier of copper. China is a massive consumer of the commodity. Economic stimulus and reboot of China's economy will increase demand for the commodity and prices.

Price above MA100Price above MA100, and testing 50% fibo retracement. good to go long if price stays above fib 38.2

Freeport-McMoran Testing Long Term Resistance FCX, Freeport McMoran is testing a long term resistance trend-line. Copper has been unfavorable as of late due to the slowdown in Chinese growth. China is the largest buyer of Copper in the global market. However, recently, the dollar down move has been reflationary for commodities in general, with the CRB commodities index rallying. Moreover, Chinese PMI's have recently bounced, alongside Europe and other EM countries. This is all bullish for Copper. Given that it is the last major commodity to turn in this dollar-down short term macro picture, FCX is ripe to break this long term resistance and head to new highs.

FCX updateNYSE:FCX
Revision to previous chart/idea. After earnings, fcx took a dump, thanks to corona virus news, copper prices dropping, and overall index weakness. Not really sure how the market will react to fed day on wed. Assuming its not too bad, i think the bullish pattern continues. FCX is on sale and could be a good long term entry. With production in Indonesia ramping up and a return to bullish copper prices we could easily hit $60 a share in a couple years.
On the other hand, if the fed disappoints and virus business continues to spook the market we might be headed to single digits (something that I have been waiting and watching for) before heading back to ATH's.
Something tells me we keep the boat afloat a while longer. Playing it day by day.
I apologize for the "busy" chart. I am still learning to chart and finding what works for me and what to pay attention to. I have another chart on investing.com that is a bit cleaner if you care to see it.
What are your thoughts?

hmmm... A/D & price action divergence brewing in FCXsomething funny goin on. I know AD has trouble with gaps. but... Somebody sneakin away with a bunch of shares here on the cheap?
And WOW yesterday .. had expected the shake.. but, dang .made me wonder .. still am ? whats next?
LETS SEE 15!

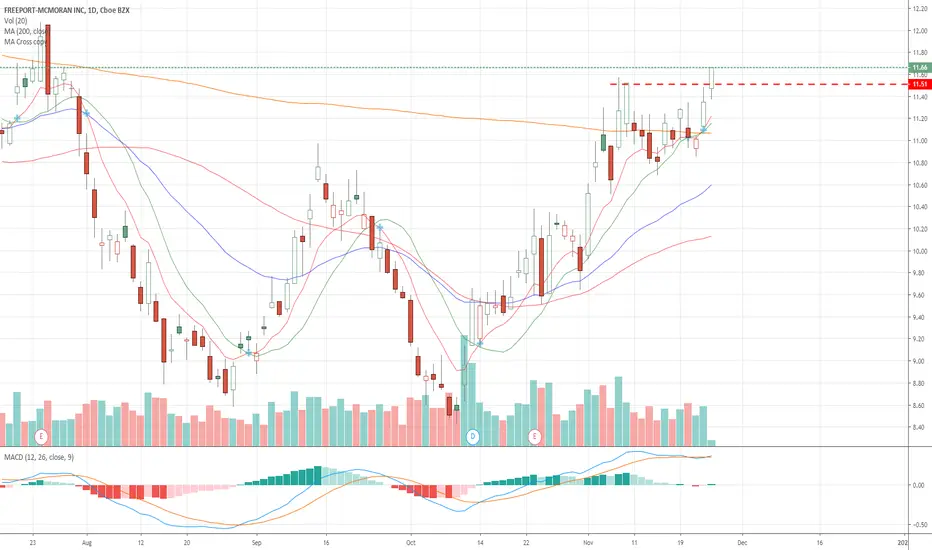
FCX breaking to new highsTime to go long FCX. The sector is moving higher and FCX is breaking out to new highs.
FCX longShort update.
Please reference my first FCX chart for my initial thoughts.
The current rally is sitting roughly at 78.6% retracement of the prior move from April 16th of 2019. As you can see we paused a little bit and consolidated after the initial move up from $8.30 (which also resulted in a pause/sideways movement). I'm looking for AT LEAST a movement to the 100% retracement at 14.51 which is currently serving as resistance from Aug-Sept double top. This level also lines up with the 2.272, 2.414, and 2.618 fib cluster extension of the prior swing high-low.
I'm looking for a small retracement of the last (second red line) movement. As you can see this movement already flagged a bit and after todays late day pump im expecting a little relief before wednesdays announcement of china trade deal.
Assuming things go okay with the signing and whatnot, I think we will at least see the 1.272 or 1.618 extension by spring/summer.
One thing to keep in mind is that FCX earnings are on Jan 23rd. Im expecting a small beat or miss. I need to refresh my memory but the prior earnings were a miss or barely beat but the FCX continued upwards on china talks and futures pumping. Earnings are turning around and production is ramping up with the opening of new deep mine in Indonesia.
What are your thoughts?

FCX - Global Growth will Send it HigherNice little 1:3 RR with potential to double within the year. This could be the start of wave 5 that could go to 17 / share.
Thanks for your like and more importantly, for you FOLLOW! Please DM or comment below with questions. Let’s make money together!

not over until its over - FCX up or down? I think up. but who knows. economy is weird machine. global economy??
its not a disaster..... yet.

