FLS | Long Setup | Seasonal Bullish Pattern | (May 2025)FLS | Long Setup | Seasonal Bullish Pattern + Solid Fundamentals | (May 2025)
1️⃣ Short Insight Summary:
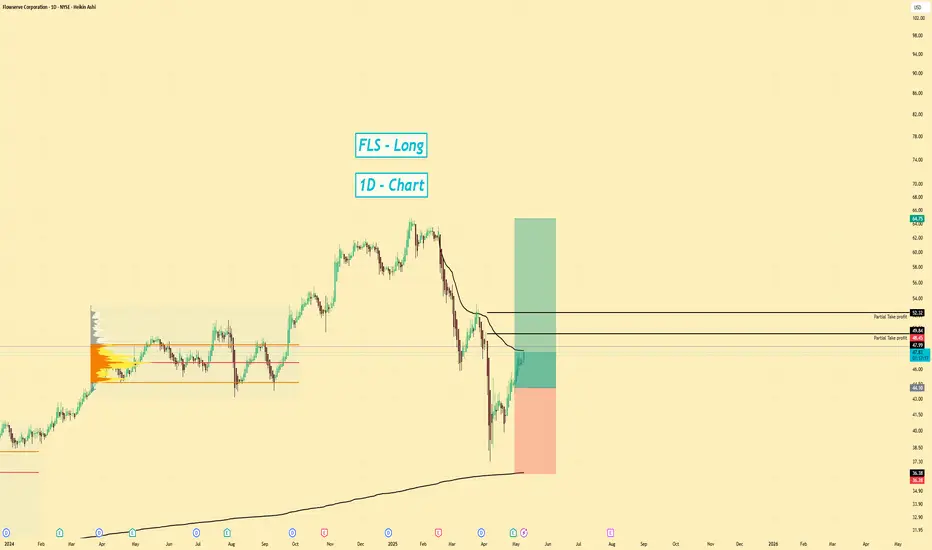
Flowserve (FLS) shows seasonal strength from mid-March to early June, supported by solid fundamentals and a bullish technical setup. A breakout from the current range could trigger continuation toward key resistance levels.
2️⃣ Trade Parameters:
Bias: Long
Entry: Around $44
Stop Loss: Below $36
TP1: $48.50
TP2: $52.30
TP3: $64.75
Partial Exits: Recommended at TP1 and TP2 to manage risk, then trail remainder toward final target
3️⃣ Key Notes:
✅ Flowserve operates in two core divisions — pumps and flow control — serving critical infrastructure with aftermarket support
✅ Revenue is ~$4.56B, with ~$282M net income and ~$1.1B in cash flow; debt sits at ~$1.6B, manageable within its current structure
✅ Market cap is $6.33B, and PE ratio is 21.87 — reasonable for an industrial with long-term contracts and stable demand
✅ Dividend yield is 1.28% — slightly declining in the past 2 years, but still attractive for defensive investors
✅ Earnings per share and revenue are projected to grow steadily on both quarterly and annual basis, despite a mild Q2 dip expected
✅ Seasonality suggests strong historical performance from mid-March to early June, aligning with current setup
✅ Beta is 1.64, indicating above-average volatility — manage position sizing accordingly
4️⃣ Optional Follow-up Note:
I'll be monitoring price action near VWAP and $44 zone for clean entry confirmation. Will update if we get structural changes or strong earnings momentum.
Please LIKE 👍, FOLLOW ✅, SHARE 🙌 and COMMENT ✍ if you enjoy this idea! Also share your ideas and charts in the comments section below! This is best way to keep it relevant, support us, keep the content here free and allow the idea to reach as many people as possible.
Disclaimer: This is not a financial advise. Always conduct your own research. This content may include enhancements made using AI.
FWV trade ideas

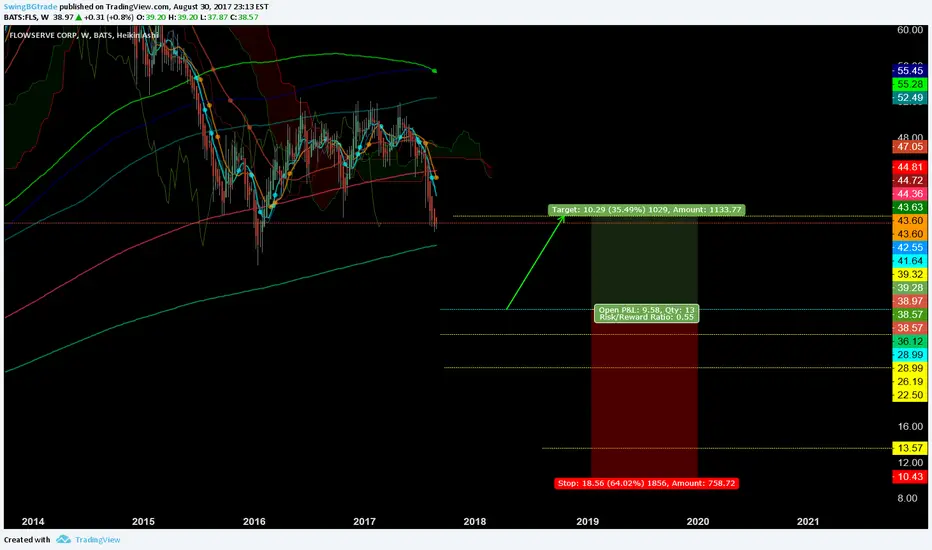
Mulitple Timeframes Signal Buy for FLSBased on historical movement, the trough could occur anywhere in the larger red box. The final targets are in the green boxes. The pending top should occur within the larger green box as has been the historical case. Half of all movement has ended in the smaller green box. In this instance, the signal indicated BUY on August 9, 2021 with a closing price of 39.20 on the 2 Hour chart and at 39.15 on the 3 Hour chart.
If this instance is successful, that means the stock should rise to at least 39.49 which is the bottom of the larger green box. Three-quarters of all successful signals have the stock rise 2.1% from the signal closing price. This percentage is the bottom of the smaller green box. Half of all successful signals have the stock rise 5.315% which is the end point of the black dotted arrow. One-quarter of all successful signals have the stock rise 8.183% from the signal closing price which is the top of the smaller green box. The maximum rise on record would see a move to the top of the larger green box. These are the same concepts for the levels in the red boxes as well.
The ends/vertical sides of the boxes are determined in a similar fashion. The peak of the rise can occur as soon as the next trading bar after signal close, while the max rise occurs within the limit of study at 40 trading bars after the signal. A 0.5% rise must occur over the next 40 trading bars in order to be considered a success. Three-quarters of successful movement occur after at least 9 trading bars; half occur within 22 trading bars, and one-quarter require at least 34 trading bars.
The black dotted arrow represents median historical movement. Medians are a good metric, but they are just one of many I use when forecasting future movement.
As always, the stock could decline the very next bar after the signal without looking back (therefore the red boxes would not come into play) or the stock may never decline (and the green boxes may never come into play).

FLS 🌦This pattern is a running flat Elliott correction wave. We don't use any indicators in our trading group. We use a combination of economics, Elliott wave, inter market, finance and fractals to comprehend market trends. We like to see markets patterns as impulse and corrections over and over again. Technical analysis need not be complicated but functional. Just because you have lots of drawings and indicators doesn't make you a good trader. This could lead to analysis paralysis. The idea is to find order in chaos. Keep it super simple!
If you like what you see why not support us?
👇


R more than 8, Long term swing opportunityHello all again. This is swing with R>8. FLS has lagged behind the machinery industry trend over a 52 week horizon, but has outperformed since last 2 quarters. The daily chart shows the over delivery vs a major ETF encapsulating the major players. FLS has been recovering the covid crash, and found itself several support points, and a decent 4 month old channel, delivering 40% growth since November. Institutional ownership is 98%, which perhaps is a negative sign, showing that the likes of you and me dont get to play much. Please see the trade plan and rationale in the chart. Also check the CRAZY volume it got today.


FLS Bullish SwingFlowserve had a good earnings which brought its profit margins way up. Stocks that are beaten down and can be bought for a "good value", like flowserve, are being bought up very quickly. This one in particular shows a strong bullish momentum - as seen by price action and technical indicators.

FLOWSERVE CORP now is in BUY Situation DailyHey guys, FLOWSERVE CORP is in a fake bearish push with low volume of sales made and a trace of buyers. On the TIMEFRAME M1 we can see a dash with a low purchase volume that is heading to breakout the range. Great possibility of a bullish facelift but for the moment not in this almost all with strong resistance. No breakout on the volume at this time (See TIMEFRAME H4). More visibility on the TIMEFRAME H1 Not enough force to go and test the intermediate median of the ANDREWS PITCHFORK.
Please LIKE & FOLLOW, thank you!


FLS - Ascending TriangleFLS created an ascending triangle pattern with a nice upside target
horizontal lines are targets and dotted line are nearby resistance
stop at close below 30

Stock FLS SeasonalityStock FLS seasonality starts to Buy date on January 31 and ends Sell date on April 14
Percent Profitable is 94.74% in 19 years and an average return of 10.23% per year

$FLS Bullish chart, but missed the boat. The chart is extremely bullish but so much so that it ran to far, to fast to be trading prior to earnings.
The stock has ran 18% in October alone, so maybe best to sit on the sidelines and wait foe a better entry level.
Yield at a low 1.5%
High 31.5 P/E ratio for industrial goods.
Company profile
Flowserve Corp. engages in the manufacture and provision of aftermarket service for comprehensive flow control systems. It operates through the following segments: Engineered Product Division, Industrial Product Division, and Flow Control Division. The Engineered Product Division segment designs, manufacture, distribute and service custom and other highly-engineered pumps and pump systems, mechanical seals, auxiliary systems and replacement parts and related services. The Industrial Product Division segment covers engineered and pre-configured industrial pumps and pump systems, and related products and services. The Flow Control Division segment involves engineered and industrial valves, control valves, actuators and controls and related services. The company was founded in 1790 and is headquartered in Irving, TX.


FSL cup & handle ..long over round number 50FSL – industrial goods
the major trend is up, a moving average 20 accompanies its movement
50 is a resistance level - a number of touches can be seen at this level on a monthly &weekly chart as well as on a daily chart.
the trading volume is currently not high, so the idea is to let the stock correct a little and follow the development of significant
volume before breaking out 50 level for a long play.
In sum, It'll be interesting over the round number after 50 will become a support.
Follow up…
this is not a recommendation to buy or sell.
as always, you are welcome to enlighten me… goodluck!


Buy on breakouta reverse head and shoulder type formation...some A rated funds are buying so may be opportunity to take a nibble and see if can get some traction on this company.
