gewatching the inflow into industrials and metals today
this is my top pick for the industrial sector
money is rotating
so we flow with the waves.
w5 target = $17
GCP trade ideas

GE singnals long for next yearsGeneral Electric moves to the alternative electric technologies and break out weekly MA 200.
This is good signal and start of the feature run.
Good point to enter on retracement to the $10.75-12.35 levels with first target at $20 and $26.8

General Electric - Lets rise and shine!-Potential 14% rise!
-Following the trend-line perfectly
-Shares of General Electric Co. GE, +1.74% shot up 4.0% in premarket trading Tuesday, after the industrial conglomerate reported second-quarter profit and revenue that beat expectations, and surprisingly generated positive free cash flow.
-On a net basis, the loss per shares narrowed to 14 cents from 26 cents, while excluding nonrecurring items, GE swung to adjusted earnings per share of 5 cents from a loss of 14 cents to beat the FactSet EPS consensus of 3 cents.
-Revenue rose 9% to $18.28 billion, above the FactSet consensus of $18.14 billion. Industrial free cash flow was about positive $400 million, compared with the FactSet consensus of negative $338.3 million, and the company raised the 2021 FCF guidance range to $3.5 billion to $5.0 billion from $2.5 billion to $4.5 billion. Among GE's business segments, revenue for Aviation rose 10% to $4.84 billion, but was below the FactSet consensus of $5.16 billion;
-Healthcare revenue grew 14% to $4.85 billion, well above expectations of $4.30 billion; Power revenue rose 3% to $4.30 billion to top versus expectations of $4.09 billion and Renewable Energy revenue jumped 16% to $4.05 billion to exceed expectations of $3.87 billion.
-"Momentum is building across our businesses, driven by Healthcare and services overall, with Aviation showing early signs of recovery," said Chief Executive Lawrence Culp. GE's stock has run up 19.6% year to date through Monday, while the SPDR Industrial Select Sector ETF XLI, -0.57% has gained 17.0% and the S&P 500 SPX, -0.61% has advanced 17.7%.

GE BIAS: UPInverted H & S pattern, due to buyer volume increase, expecting the price to break up the resistance ahead, Make sure to apply SL and TP.

"Complex" Head and Shoulder Bottom forming on GE Weekly Chart?Good morning all!
MY thoughts are that Larry Culp's turn around efforts are beginning to bear fruit. With a good earnings report and outlook I feel that this could push GE into breaking out of an inverted H&S bottom and begin moving up. I'm using T. Bulkowski's pattern probabilities from his "Encyclopedia of Chart Patterns" as a guide and added a few thoughts of my own.
I welcome any and all discussion, Bulls OR Bears.
Big Poppa


GE Bias: UpIn lower timeframe the price has entered ranging market, buyer came in, potential short term buy trade. Make sure to apply set loss and take profit level to all your trade.

I placed a trade for Call option to target $14.5It only cost $1 per contract (100 stocks)!! why not ! lol


GE - where I bought callsEntered calls (shown by ellipse) this morning after seeing the break from the downward trendline and a retest on the MA. Using a lower timeframe to see the momentum. Expecting more from this trade.
Trade smart and have fun!
SLAM the like button and the ask! Cheers!

GE Trend ReviewComposite Model -- Neutral but remains close to switching bullish
Trend Bands -- Acted as support. Bullish
Linear Regression -- Overextended 2 STD to the downside
Trend Oscillator -- Bullish since November 2020
Trend Clouds -- Well over-expanded. Looking for a reversal to the upside.
Overall: All signs point to bullish. The clouds and linear regression point to an imminent reversal.

GE Bias: UpOverall the price is trading in range, bounce from minor support, potential buy trade with tight stop.


GEGE at the bottom of the range showing hidden bullish divergence on both macd and rsi
right at the 200 moving average
could see nice swing up in price towards top of the range

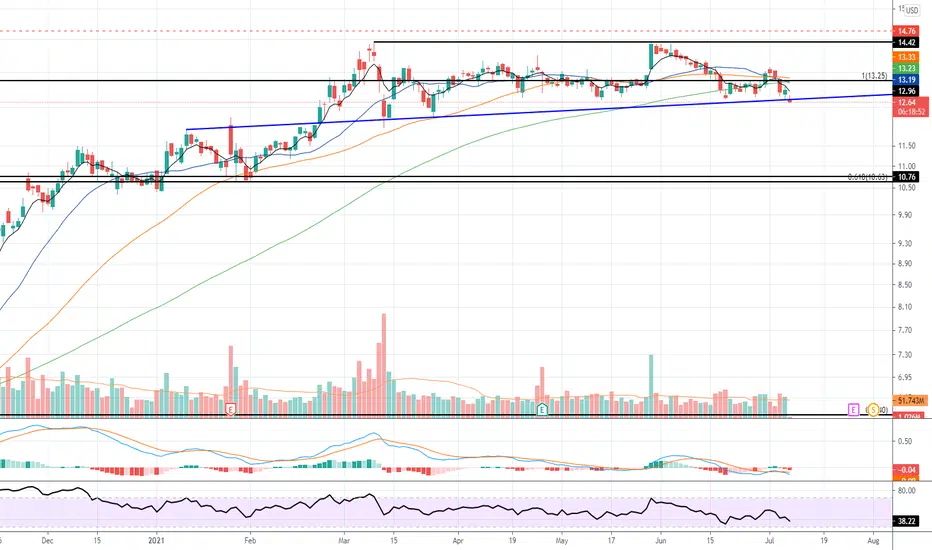
These patterns can make GE fly to the $13.90! 👀We are in a consolidation, and the 13.19 is a ceiling for GE, while the 12.94 is a floor. According to Al Brooks, 80% of the breakouts are going to be false, so we must be careful.
The time to buy is near the support, but there’s a chance we’ll see a breakout from the 13.19.
We have a possible advanced breakout in the 4h chart, and if confirmed, this can make GE fly and close the gap around 13.90.
This is something that favor the buyers, but again, let’s wait for the confirmation on the price action! Also, the 20ma is right there above us, so, we must see a good breakout as soon as possible.
If you liked this trading idea, remember to click on the “Follow” button to get more trading ideas like this, and if you agree with me, click on the “Agree” button 😉.
See you soon,
Melissa.

Long GE with good upside potentionCan initiate a long swing trade on GE if the close offers a good RR ratio of more than 2.5.

Bullish on General electric. GELatest set of zigzags seem like a whole bunch of flats taking up quite a bit of fibtime. This is classical of a Wave 4. A careful count confirms this at an eagle eye view. If that assessment proves to be true, then we have one more move up, and given the moves already made, it might be quite a big one comparatively.
Fibonacci goals are in green, reversal or invalidation is in red. This post is not financial advice, make your own financial advice or pay a certified professional ( you are to statistically faire better at blindly longing SnP500 incase of the latter). Playing on the market whether you are an investor or a trader is risky. No good thing is ever without. Good luck out there.


SHORT idea on GE. SHORT idea on GE. Playing the Volume profile gap and FIBs. This is not financial advice and if you're taking financial advice from me I also have some real bitcoins for sale and they come in a pack of 12.


Time to blow off the roofWe had a huge run-up on 27th of May.
I believe it will have a nice continuation, but the price needs to sonsolidate for a while first.
I will enter when the RSI will be oversold on the hourly timeframe and around 13,75-13,40.
The overall picture looks very bullish to me.
