HSBC Forming a Possible Right ShoulderInverse H&S pattern if the right shoulder is formed it'll be the first higher low in years.
Weekly Bullish Divergence
HBC1 trade ideas


HSBC looking bearishEurope's largest lender HSBC says pre-tax profits dropped 18% year over year and abandoned a profitability target as Hong Kong's protests and the U.S.-China trade war took their toll
Technicals are not looking good too.
55.76 - 55.15 range is the next price target.

38.2% & POSSIBLE 61.8% Retracement LONG GWAVE38.2% & POSSIBLE 61.8% Retracement LONG GWAVE.
FIB Retracement Percentage is calculated in a Higher Cartesian and or Euclidean Dimension.
PLEASE ALWAYS WAIT FOR STOCHASTIC CONFIRMATION!!! THANKS


HSBC potential reversal!
HSBC expected to rise up to 1st resistance at 38.99 where it could potentially react off and drop down to 1st support at 35.48.
Trading CFDs on margin carries high risk.
Losses can exceed the initial investment so please ensure you fully
understand the risks.

Buy & Sell Scenario on HSBCSell and Buy scenario from MN chart to H4 chart. The price is near the crises level, bullish divergence at the same time.
PS: It's just my vision. Make your own actions!
Have a great day!

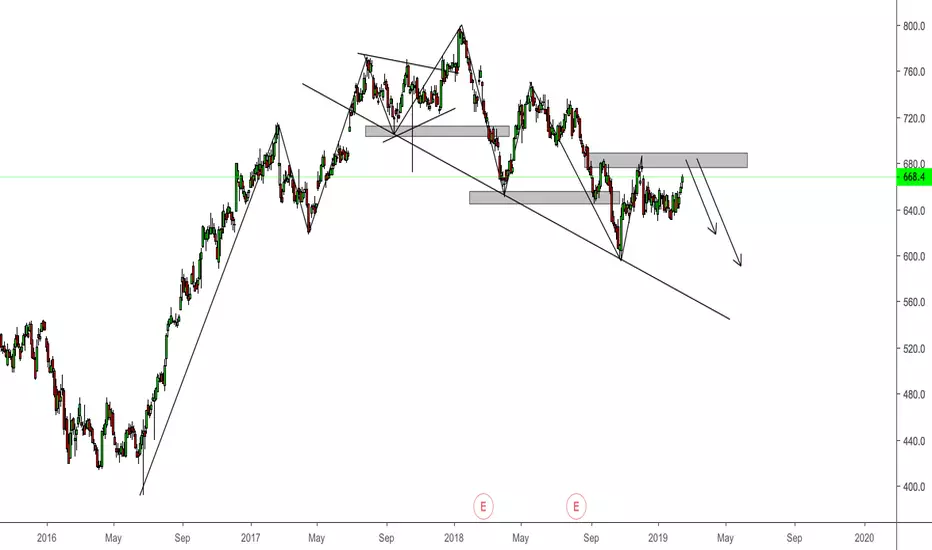
HSBA trending downwards, currently holding supportJust throwing some lines on HSBC (HSBA) .
We have a broadening channel, higher highs and lower lows on a 20 year timeframe.
Currently in a downward trend on the monthly, just about holding historical support.
This would probably be a good place to exit if we are expecting a market downturn.
"These formations are relatively rare during normal market conditions over the long-term" - Investopedia

HSBC (HK Entity) One of the two largest financial players in HK, and most certainly a derivative trade of the larger macroeconomic story. Keep this chart handy near-term.

HSBC reversed from resistance, potential drop!
HSBC reversed off its resistance at 42.01 where it could potentially drop further to 41.16.
Trading CFDs on margin carries high risk.
Losses can exceed the initial investment so please ensure you fully
understand the risks.

HSBC Bullish For Stock Market ReboundHSBC is trading this month in congruence with the current global stock market pullback by offering a time-relative discount in share prices.
HSBC target $43 for a 5.4% difference from the current quote of $40.78. The S&P 500 is off 7.5% from doubly tested but not yet broken all time highs which renders this parallel HSBC trade idea as conservative and defensive. The duration for this trade is 1-3 months.

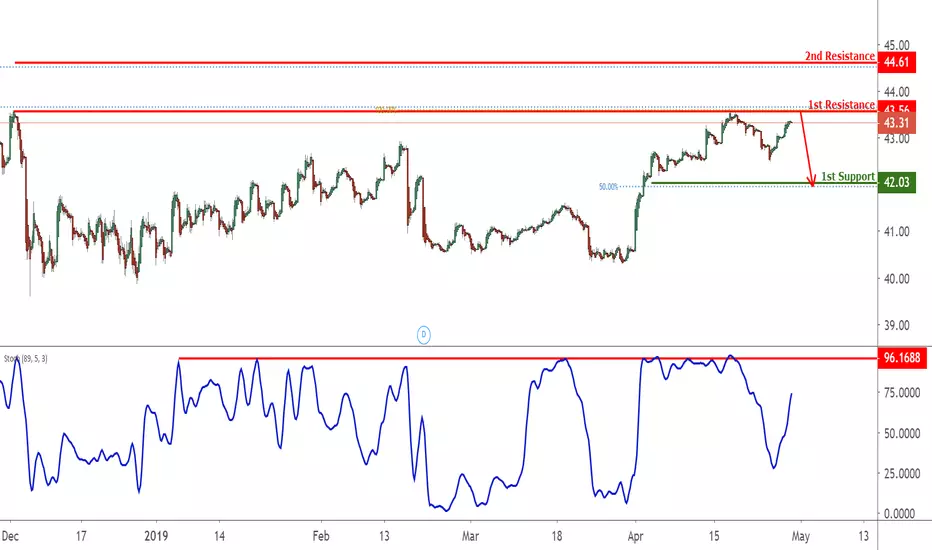
HSBC Approaching Resistance, Potential Reversal! HSBC is approaching its resistance where a reversal could occur.
HSBC Reversed Off Resistance, Potential Drop!HSBC reversed off its resistance where we could see a further drop to its support.

Divergence with RSI vs OBVThere is a low OBV with a growing RSI.
HSBC is also reaching a resistance.

HSBC Approaching Resistance, Potential Reversal! HSBC is approaching its resistance where a reversal could occur.
HSBC Reversed Off Resistance, Potential Drop!HSBC reversed off its resistance where we could see a further drop to its support.

HSBC Approaching Resistance, Potential Reversal! HSBC is approaching its resistance where a reversal could occur.


HSBC Approaching Support, Potential Bounce!HSBC is approaching support where a potential bounce to its resistance could occur.


HSBC Approaching Support, Potential Bounce!HSBC is approaching its support at 40.33 (100% Fibonacci extension, 78.6% Fibonacci retracement, horizontal swing low support) where it could potentially bounce to its resistance at 41.19.
Stochastic (55, 5, 3) is approaching its support where a corresponding bounce could occur.

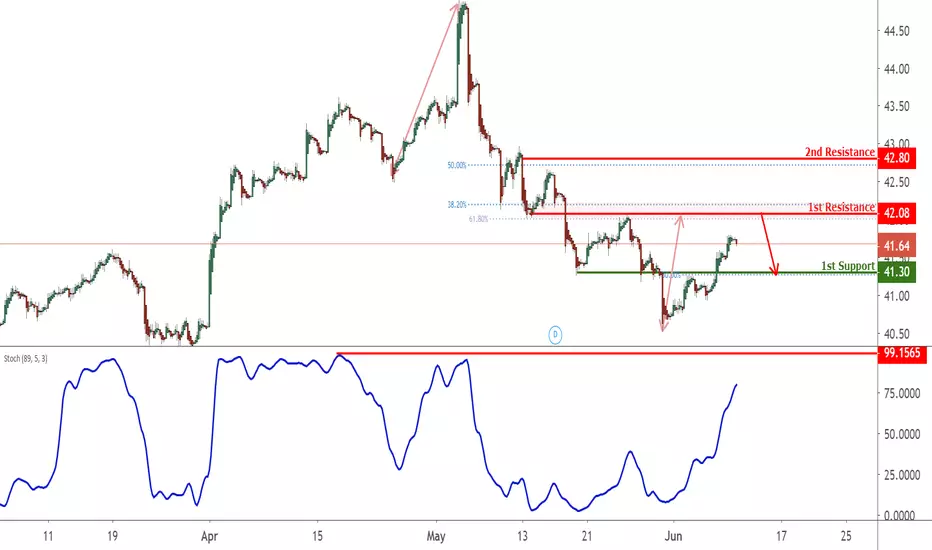
HSBC Approaching Resistance, Potential Reversal!HSBC is approaching its resistance at 42.68 (61.8% Fibonacci extension , 78.6% Fibonacci retracement , horizontal swing high resistance) where it could potentially drop to its support at 41.54.
Stochastic (89, 5, 3) is approaching resistance as well.
