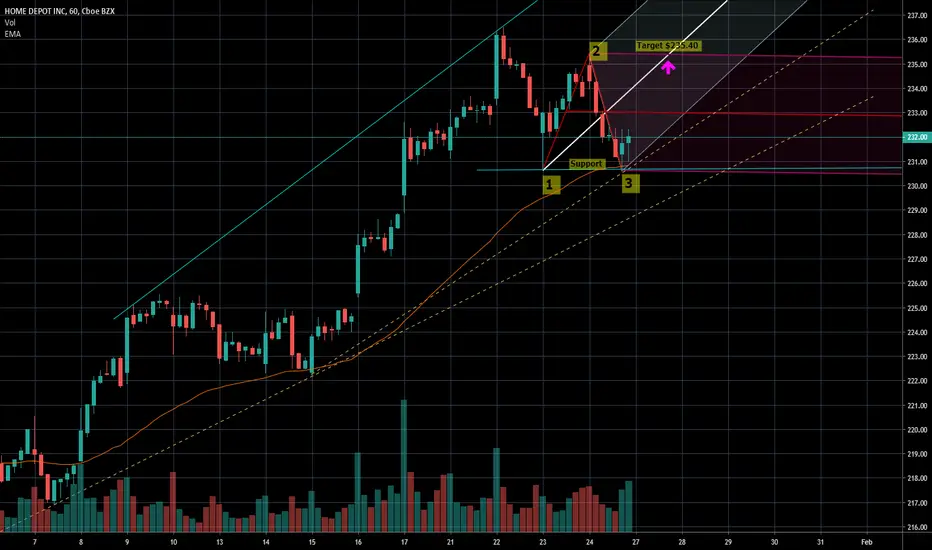
Bullish If it breaks the rejection points at $232.30, we are looking at TG1 $235ish area and if it continues TG2 $237.
HDI trade ideas
Short $HD into earningsWe got a live block trade today at about 9:34 AM EST. I am thinking of a short here as it looks like a buy capitulation is underway with the rest of the stock market after the #CHINA and #USMCA vote.

HD Long on SMA 200 bouncePros:
- FI and MACD both trace higher low even when the price is at lower low.
- RSI traced double bottom and RSI starting to slope up
- MACD histogram in weekly trend has alredy ticked down quite abit (lower potential downside)
- High potential profit if prices break above SMA200. Can realistically expect 4R-5R profits
Cons:
- Volume on red days still relatively high. Ideally would prefer a decline in red days volume as prices goes down for Long trade. I am betting on the SMA 200 holding based on FI, MACD and RSI

May the trend ContinueHome Depot shows a beautiful pullback to 200 moving average and also Fib 0.382, looks like it will continue the trend towards the golden ratio of 257$ Golden ratio 1.618


HD long term BUYHD I have it as a BUY today by my indicators. I could see it going back to retest the highs. Coming off support at the 200sma. Volumes good for 1/2 day. Earnings behind you. MACD crossing higher. Supporting MA's crossing bullish. I like it.

HD should be good for a post-dividend bounceHome Depot's momentum has definitely been slowing lately, and the stock dipped hard after its latest less-than-stellar earnings report. However, the stock often dips before its dividend and then bounces after. With the stock going ex-dividend today (0.63% quarterly yield), it may be time for a bounce buy. December is usually a good month for Home Depot stock, and November's strong housing and construction data favor Home Depot's earnings success in the next quarter. HD has a 7.8/10 analyst summary score, an average analyst price target of $239 per share, and more-bullish-than-usual options interest today.


Long on Home Depot As part(10%) of the XLY sector ' looking at Home Depot with a 200 MA solid support .

Weekly reversalUpdate from this weekend's chart, we are still in calls on this out until January. You can now see the weekly reversal candle.


$HD Reversal trade alert on Home Depot Entry level $215.03 = Target price $228 = Stop loss $212.69
Indicators in reversal.
Bullish bounce of the 200ma
Possible break from falling wedge
Average analysts price target $235 | Overweight
P/e 21.28
Home Depot, Inc. is a home improvement retailer, which engages in the sale of building materials and home improvement products. Its products include building materials, home improvement products, lawn and garden products, and decor products. It offers home improvement installation services and tool and equipment rental. The company was founded by Bernard Marcus, Arthur M. Blank, Kenneth Gerald Langone and Pat Farrah on June 29, 1978 and is headquartered at Atlanta, GA.

$HD Swing Trade Plan$HD : Possible to bounce from here. Holding 200SMA on daily. Expecting strong bullish move from here.

Weekly dojiHD has weekly doji, hourly is triple bottom with nice accumulations and the daily tagged the 200sma.

HOME DEPOT - Can we head back up to $223.50Price is forming a falling wedge which tends to indicate a bullish move. We will be waiting for price to break the wedge for a bullish confirmation.
If price breaks the wedge trendlines, we can expect price to push back to $223.50s

