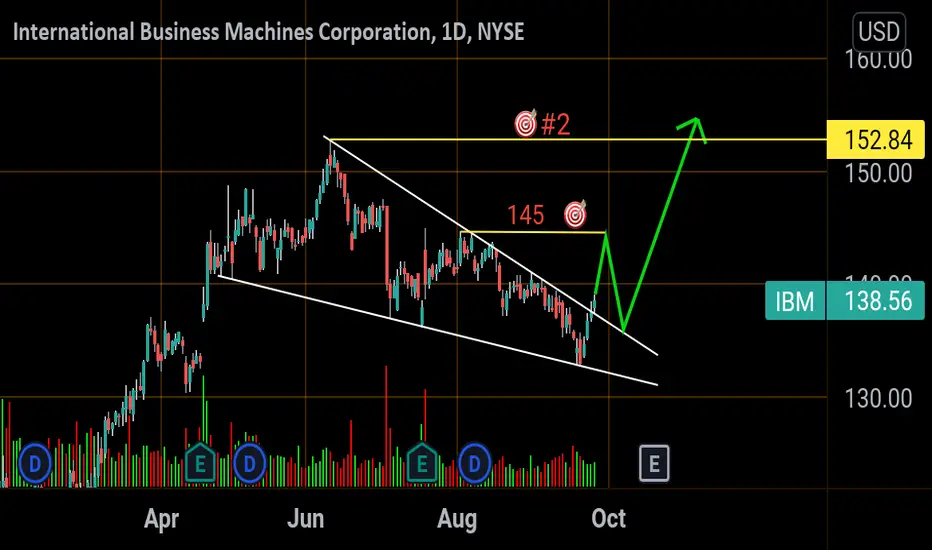
IBM wedge breakout Broke out on the chart and also from its RSI divergence.
1st TP 145
Then a pullback to wedge breakout
finally
2nd to 153
IBM trade ideas
Buy IBM Swing Trade with strict Stop lossBuy IBM Swing Trade with strict Stop loss
Education purpose only

IBM Elliot countThe Last 2 quarters saw a positive earning stream, and the Elliot wave count depicted at the chart, indicates that corrective wave 4 has finished and wave 5 is under way with a target of 158.60$. Carefully for that wave 3 top at 152.74$. As usual stop loss 10% from entry, a don't forget the Capital at Risk, per Trade.

IBM:FUNDAMENTAL ANALYSIS|PRICE ACTION+NEXT TARGET|SHORT IDEA 🔔International Business Machines continues to transform itself into more of a cloud computing company. Since it acquired Red Hat a couple of years ago, it has increasingly distinguished itself as a hybrid cloud leader. In addition, the spin-off of the managed infrastructure services business may allow IBM to focus solely on that growth.
Nevertheless, while IBM offers investors many reasons to buy, one key issue may scare off some investors in the near term.
The first advantage is the impending spin-off of Kyndryl.
Despite IBM's breakthroughs in chip manufacturing and supercomputing innovation, the company's fastest-growing segment is the cloud. CEO Arvind Krishna has been committed to turning IBM into a cloud player since he took the helm in April 2020. He was instrumental in Red Hat's acquisition, and Red Hat's Kubernetes and OpenShift software can simplify the communication problems inherent in public and private clouds working with each other.
Moreover, Kyndryl's spin-off from IBM should facilitate this transition, and IBM shareholders will receive a portion of Kyndryl's stock at the time of this spin-off. While this may seem like a convenient way to offload an inefficient business, Kyndryl is taking a $60 billion backlog with it. This volume of work allows Kyndryl to arrange a turnaround under a management team focused solely on the managed infrastructure business.
Krishna believes that once Kyndryl becomes a separate division, IBM will be able to consistently deliver mid-single-digit revenue growth, a significant improvement for a company that has sometimes failed to deliver positive revenue growth in the recent past.
A second advantage is dividends and cash flow.
IBM continues to generate cash flow despite its difficulties with earnings growth. Over the past 12 months, the company has generated about $9.7 billion in free cash flow, enough to easily cover $5.8 billion in dividend expenses over that period.
These dividends have long pleased investors. The company now pays shareholders $6.56 per share a year, which at current prices is about 4.7%. This is considerably higher than the 1.3% that the S&P 500 Index currently yields on average.
In addition, IBM has the status of a dividend aristocrat, as the company has increased its payout for 26 consecutive years. Investors should note that both IBM and Kyndryl will retain aristocrat status after the separation. However, the decision to retain aristocrat status will be made separately by the boards of IBM and Kyndryl.
The third benefit is an improved balance sheet.
IBM's cash flow is crucial for another reason. IBM's current debt is $55.2 billion, a huge burden when the company's equity is just over $21.9 billion. Nevertheless, while this debt remains a big burden on the balance sheet, shareholders should remember that the company has reduced debt by $6.4 billion in the past 12 months. It has also reduced those liabilities by $17.9 billion since the Red Hat acquisition in 2019.
That is significant because the Red Hat purchase cost IBM $34 billion. In the second quarter of 2019, the company increased its total debt by $23 billion in one quarter to cover the cost of the acquisition. So so far, the company has paid back all but $5 billion in debt from the Red Hat deal.
The only downside is the uncertainty about the Kyndryl division.
Unfortunately, questions remain about what each company's balance sheet will look like after the spin-off. For example, IBM has not said how it would distribute the remaining debt load between the two companies. That is important because an unfair split could jeopardize the balance sheet of at least one of the companies.
Among other things, the issues go far beyond the level of debt and the state of IBM's equity capital. Although the company has told shareholders that they will receive a portion of Kyndryl's stock, they have no clear idea of the number of shares they will receive. In addition, IBM has not disclosed how much of Kyndryl's revenue, net income, or free cash flow is generated and how this affects shareholders on a per-share basis. This uncertainty about the company's valuation comes at a time when IBM's P/E ratio has risen above 23, something not seen since 2018.
In addition, this uncertainty is particularly important to IBM's dividend-oriented investors. IBM has told shareholders that the two companies will split the payout. Thus, investors cannot accurately gauge each company's future earnings or their ability to keep the portion of the dividend they receive.
So should you consider IBM? Despite the unanswered questions, both companies should perform better as separate units. Since IBM is more of a cloud company, its massive growth in that niche should have a bigger impact on its stock. Moreover, Kyndryl probably has a better chance of turning a huge order book into growing revenue, since its only priority is managed infrastructure.
However, income-oriented investors face profound uncertainty because they don't know which part of the business will provide the most support for payouts. For this reason, investors in this class should consider staying on the sidelines until more information becomes available.
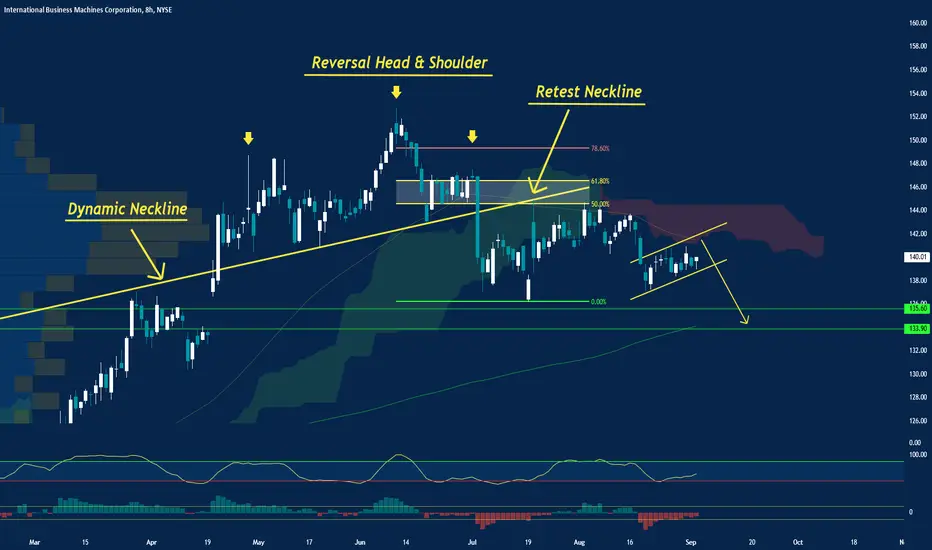
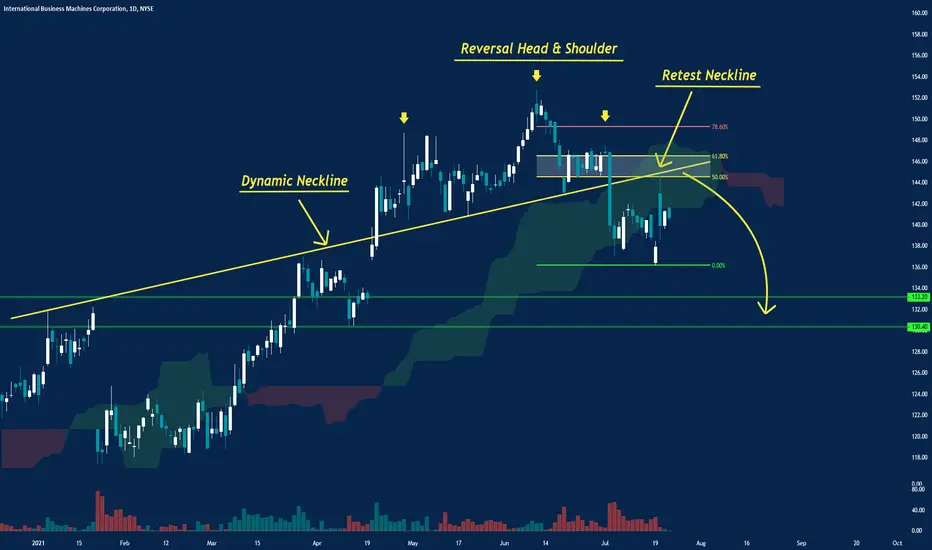
IBM | Technical Breakouts, Waiting For a RetestHi,
IBM got a rejection from quite an important area and the rejection guided the price through some strong price levels - breakouts.
Do your own fundamental research and if this matches with my possible bullish scenario then wait for a retest around $117 - $134 and you are ready to go.
Happy Independence Restoration Day in Estonia!
Regards,
Vaido

Is IBM the Next Oracle?A lot of people forget about International Business Machines. However the 110-year old tech giant’s chart has some interesting patterns.
First and most important is the series of higher lows since early July. IBM has been trapped around the same $144 area where it bounced on June 21. That combination (higher lows + resistance) has produced a bullish ascending triangle with breakout potential.
Also notice how the 50-day simple moving average (SMA) and 100-day SMA closely match the top and bottoms of the ascending triangle.
The current squeeze is so tight that Bollinger Band Width has narrowed to its lowest reading since January 2020. This could add fuel to a breakout.
Finally, don’t forget about Oracle. The lumbering software giant broke out this year after its Cloud business improved. IBM gapped higher after showing similar progress its last two quarters. With a 12x forward P/E and price/revenue under 2x, it could also benefit from sentiment shifting toward value stocks.
TradeStation is a pioneer in the trading industry, providing access to stocks, options, futures and cryptocurrencies. See our Overview for more.

IBM symmetrical trianglesymmetrical pattern on the 2hr
orange box safest buy zone
expect small 4hr pull back

IBM D1 LONGTechnical Analysis »Due to the reversal of the uptrend line and having a candle pattern, you can bet on a price uptrend
Fundamental Analysis »and according to the infrastructure bill and the $ 3.5 trillion resolution, we should expect good data from the company's profitability.


CypherD is at the .786. The 2nd peak is higher than the first peak. Price is under the 50 and sometimes patterns fail or morph in to another pattern.
The cypher is a technical wave pattern in which the market is trending but it makes sharp reversals during the day. The important point of the bullish cypher is that both the lows and the highs are trending upwards. For the bearish pattern , the opposite happens.
You can recognize a Cypher by looking at the 2 peaks. The 2nd will be higher than the first peak.
It is labeled XABCD and stop can be placed under D.
AB= 0.382 to 0.618 retracement of the XA swing leg;
BC= extend to minimum 1.272 and maximum 1.414 of the XA swing leg;
CD= retrace to 0.786 of the XC swing leg;
No recommendation.
The shark also has a 2nd peak that is higher than the first peak and pulls to the .886 or the 1.13 on the BC leg as the shark is labeled OXABC verses XABCD like the Cypher. On a shark pattern, some place the stop under C.
Short interest is 2.54% and the short ratio or days to cover is 5.5.
Significant move for IBM today as it is not known as a rocket stock. More a slower mover with a high dividend. Volume does not match the move so far today but may catch up. Possible bullish divergence on RSI is set at 80 and 30.

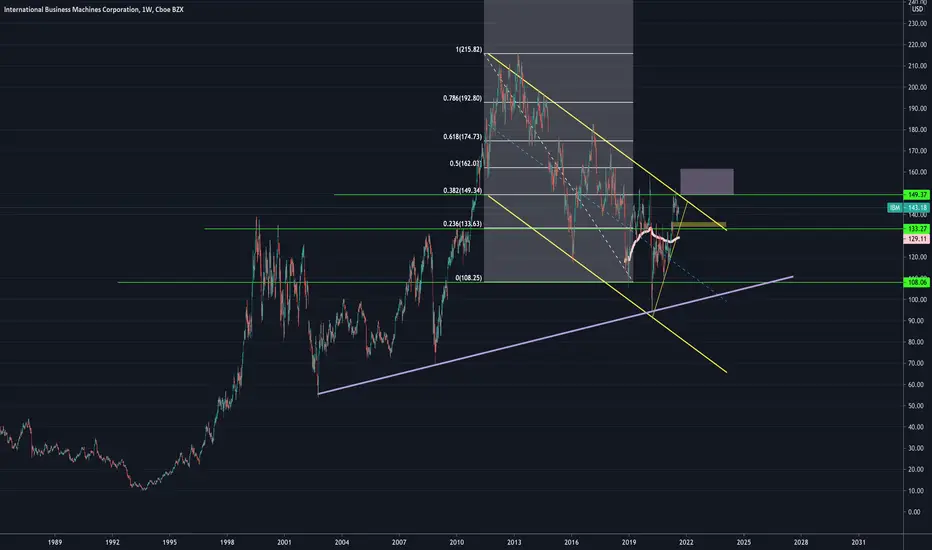
End of 8 years of downtrend??? IBM big picture!Hello!
For the moment is still downtrend (short positions), you can entry now because is almost at the trend resistance, for TP I'm looking for the next 2 supports.
But also i can see on the graph a possible Head and Shoulders in formation, we will talk when the price meet the first support. Till then, enjoy the SELL.
I will put an entry with SL and TP on the comment section.
Enjoy!


IBM:FULL DETAILS FUNDAMENTAL+PRICE ACTION ANALYSIS|SHORT SETUP🔔IBM just posted its best quarter in years. This tech giant demonstrated very modest overall revenue growth in the second quarter of 2021, but an expansion in its cloud computing business, driven by its flagship Red Hat, which the company acquired in 2019. For income-seeking investors, IBM is a great dividend stock right now, and the hope is that growth will be even stronger after the Kyndryl spin-off is completed by the end of this year.
Here are several reasons why IBM is one of the best variants to buy right now.
- IBM's cloud solution sales are too undervalued
In the second quarter, IBM's total revenue rose just 3% year over year to $18.7 billion, and in the first half of the year, sales rose 2% to $36.5 billion. No big deal given the fast-paced digital age we live in, but not too bad for IBM given that it has been stuck in a steady decline for years.
Hidden beneath the surface and helping IBM regain positive momentum, however, is its huge cloud computing segment, which is still noteworthy. Total cloud computing sales were up 13 percent from a year ago to $7 billion, led by cloud provider Red Hat, which reportedly grew 20 percent. In fact, Red Hat has accelerated from the pace it set last year.
In fact, this strong performance of the cloud segment is the main reason IBM is spinning off its managed infrastructure segment (which we now know will be called Kyndryl). While technical infrastructure hardware is still an important segment of IT, it is not a growth area. It also offers lower profit margins than cloud software. Thus, the new IBM will focus more on its cloud business, which should help it achieve higher growth and earnings potential once the spin-off is complete by the end of this year.
- A high level of free cash flow generation
Of course, in the period leading up to the new cloud-focused IBM, it's primarily a dividend stock. And when it comes to dividend payments, it's all about free cash flow generation. IBM is doing well in that regard. In the first six months of this year, free cash flow was $2.56 billion, which pretty much covers the $1.47 billion paid out as dividends to shareholders.
Of course, $2.56 billion is a bit less than the $3.65 billion in free cash flow generated in the first half of 2020. So what's the bottom line? First, IBM spent $1.22 billion in 2021 on one-time expenses related to setting up the Kyndryl division. Setting that amount aside, free cash flow would have increased by 4%. IBM also spent $2.87 billion on cash acquisitions this year.
Since January, it has acquired nine smaller software and consulting companies to bolster its presence in cloud computing. Setting aside these acquisition-related costs, IBM would report an impressive 81% year-over-year increase in free cash flow in the first half of 2021.
In other words, IBM's current dividend yield of 4.7% is a good bet right now.
- Improving the balance sheet
When it comes to tech giants, industry leaders (like FAANG stock) have net cash. But not so at IBM. The more than century-old company has far more debt than cash. At the end of the second quarter, the company had $7.35 billion in cash and cash equivalents and another $600 million in marketable securities, but still had $55.2 billion in debt.
It's far from the nicest-looking balance sheet, but progress is evident. IBM had $61.5 billion in debt at the start of 2021, so the old tech company has reduced its obligations to bondholders by about $6.3 billion this year -- and has reduced debt by $17.9 billion since buying Red Hat in 2019. Although there's still work to be done, IBM has an investment-grade credit rating due to its strong free cash flow generation, and it can handle both dividend payments and gradual debt repayments.
The sale of Kyndryl promises to be a major event for IBM later this year, but for now, it is the best dividend company for investors looking for additional income. At the time of writing, the company's stock price is up 12% this year.
I'm no genius, but this characterizes several Weekly chartsI have looked over several charts tonight, taking a look specifically for Tickers on the Weekly with a green upweek this week.
Coincidentally I had the 200 MA turned on and started noticing how Price on a lot of things really on their Weekly charts have had this problem. A problem of being stuck underneath the 200 MA for quite some time now.
What is beginning to get interesting is that recently a few names like CAH, and IFF have broken through.
So I went looking for a few more common interests in the blue chip world and first stop was IBM.
Have a look. The 200 slope rode higher for 9 years, and has been pulling back for 6 years. We're sitting right on top of a 50% rectracement of the moving average line motion.
Certainly has perked my interest for any long term ideas, and about just how much power could be behind any more selling in the market. When you consider how long IBM has been worked underneath the 200 on the Weekly, does it being to shine light that maybe we're at the start of trend in a different direction?

$IBM with a Neutral outlook following its earnings #Stocks The PEAD projected a Neutral outlook for $IBM after a Positive over reaction following its earnings release placing the stock in drift B
If you would like to see the Drift for another stock please message us. Also click on the Like Button if this was useful and follow us or join us.

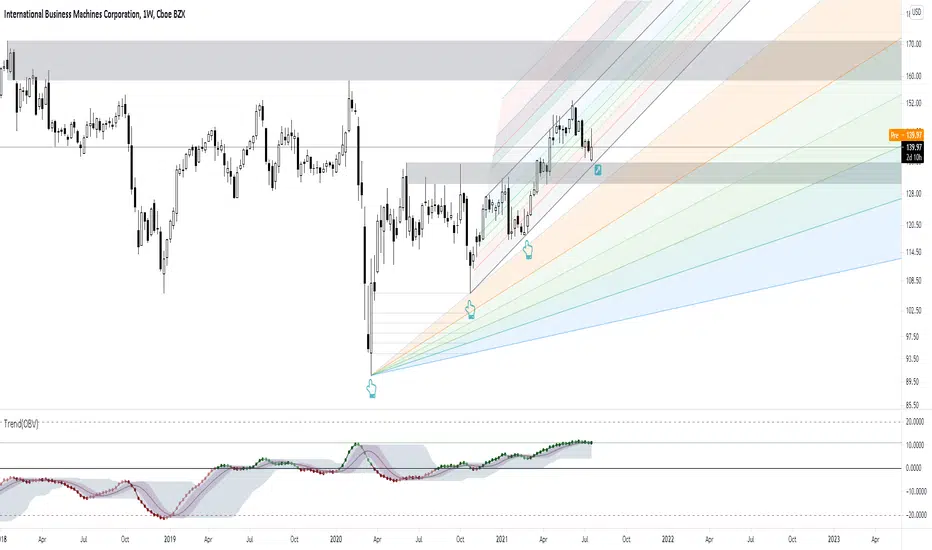
trading into its splitI used my biased Fibonacci channel and fan along with horizontal zones to determine a stock major trend, minor oscillations, as well as entries/exits from trading.
Fibonacci lines are highly subjective. The trader chooses pivots which deem to be significant, yet the market may not view these them as significant and thus may not respect or react as expected to the drawn levels.
Sunday Prep 7/18 - $IBM SHORTIf the numbers are good and this gaps up, I would be looking to fade if it spikes into the monthly pivot around 147.

$IBM - Head & Shoulder playing out. $133 gap fill possiblePlaying out head and shoulder. Neckline broke.
$133 gap fill possible.
Target 1 - $133
Target 2 - $130
———————————————————
How to read my charts?
- Matching color trend lines shows the pattern. Sometimes a chart can have multiple patterns. Each pattern will have matching color trend lines.
- The yellow horizontal lines shows support and resistance areas.
- Fib lines also shows support and resistance areas.
- The dotted white lines shows price projection for breakout or breakdown target.
Disclaimer: Do your own DD. Not an investment advice.

Volatility into and on its earning day is a trading opportunityI used my biased Fibonacci channel to determine a stock major trend, minor oscillations, as well as entries/exits from trading.
The Fibonacci channel is a technical analysis tool that is used to estimate support and resistance levels based on the Fibonacci numbers. It is a variation of the Fibonacci retracement tool, except with the channel the lines run diagonally rather than horizontally. The lines from the channel is used to aid in identifying where support and resistance may develop in the future. If the uptrend is expected to continue, the 100%, 161.8%, and other higher levels are potential price targets. The same concept applies to downtrends if a downtrend is expected to continue. In an uptrend, the zero-line is like a normal trendline, helping to assess the overall trend direction. If the price falls below it, it may need to be adjusted based on more recent price action, or it could signal that the uptrend is over and that the price is breaking lower. In a downtrend, the zero-line also acts like a trendline. When the price is below it, it helps confirm the downtrend. If the price moves above it, the indicator may need to be redrawn or the price is moving higher out of its downtrend.
Fibonacci channels are highly subjective. The trader chooses three points they deem to be significant, yet the market may not view these points as significant and thus may not respect or react as expected to the drawn levels. One of the complaints with Fibonacci analysis, in general, especially on short-term charts, is that there are so many levels that the price is likely to reverse at or reach one of the levels. The problem is knowing which level will be important in advance.
