IBM trade ideas


IBM Head & ShouldersIBM completed a Head and Shoulders pattern on strong volume, indicating the downward trend is likely to continue. Given the downtrend has gone on for some time now, I would look for a small pullback before the stock's decline continues.
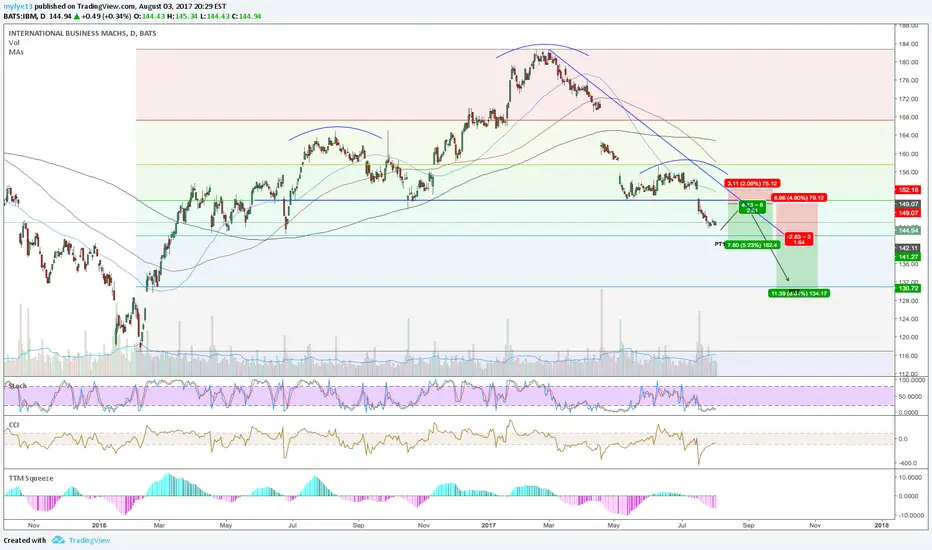
OPENING: IBM JULY 28TH 145/148/160/162.5 IRON CONDOR... for a 1.10 credit. It announces earnings today after market close.
Metrics:
Probability of Profit: 54%
Max Profit: $110/contract
Max Loss/Buying Power Effect: $190/contract
Break Evens: 146.90/161.10 (Wide of expected move, both sides)
Delta: .37
Theta: 6.08
Notes: The strikes were pesky on the call side. It was either go five-wide or 2 1/2 wide on the call side. I opted for going narrower, as long as I could keep my break evens outside the expected move. Will look to take profit at 50% max.


short ibm below 152.00I would strongly suggest shorting ibm below 152.00 with a stop at this stage of 152.65 and an initial target of
150.70. This stop may seem a little large but I have a ninety per cent success rate through my own propriety
method.This is just for information purposes.I will post more as I go so feel free to follow or contact me and
maybe when you are satisfied that I know what im doing ask me about taking a few trades with me.
Best Regards.


IBM: A better future ahead? Breakout confirmed over 154.26 in good volume, as expensive technology stocks continue to correct downward and the market continues to chase better value. IBM can now be purchased with a stop-loss at 150 and targets of 158/162/168/180. Blended reward-to-risk of 1.5x to 2.5x depending on where the momentum on the stock takes us. In the best case scenario of IBM reaching the top of the long term channel towards 175, the risk-reward becomes a compelling 4/1. Note that this breakout takes place just above the MA100 support on the weekly chart. Options strategy highlighted in related idea below still valid.

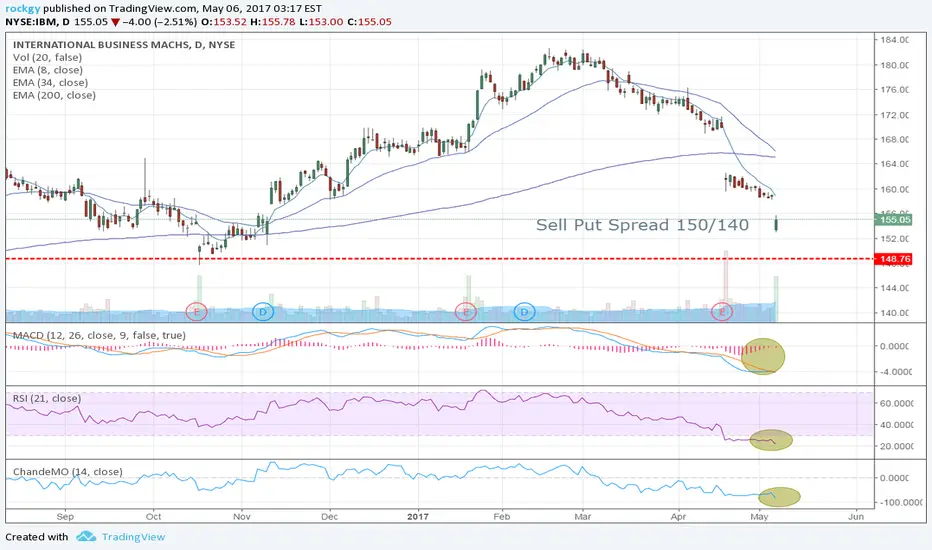
Long IBM by selling June Put Spread 150/140IBM has been pulled back form 184 for almost 30$. After the news of Buffet reduce 1/3 of his position, IBM gap down but start to bounce back. RSI and CMO both showed oversold signal. I would like to set up this position long IBM.
Position:
Credit Put Spread: -1x, June 150/140,
Premium: 1.2$
Break Even: 148.8$
PoP%: 75%
Target: 50% of the premium.
In case IBM continue going down, I am ready to be exercised and get IBM stocks with $148.8 per share.
Critical RSI points of contact for IBMWait until the solid green line on the RSI has been broken before entering. Success is more important than a few missed dollars.
If anyone has comments on the black trend lines please reach out to me. Open communication just makes us smarter

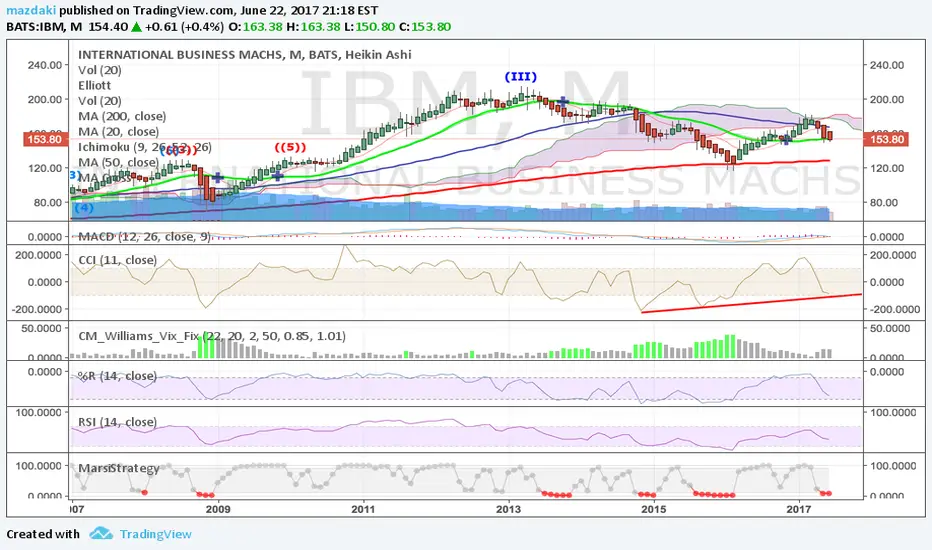
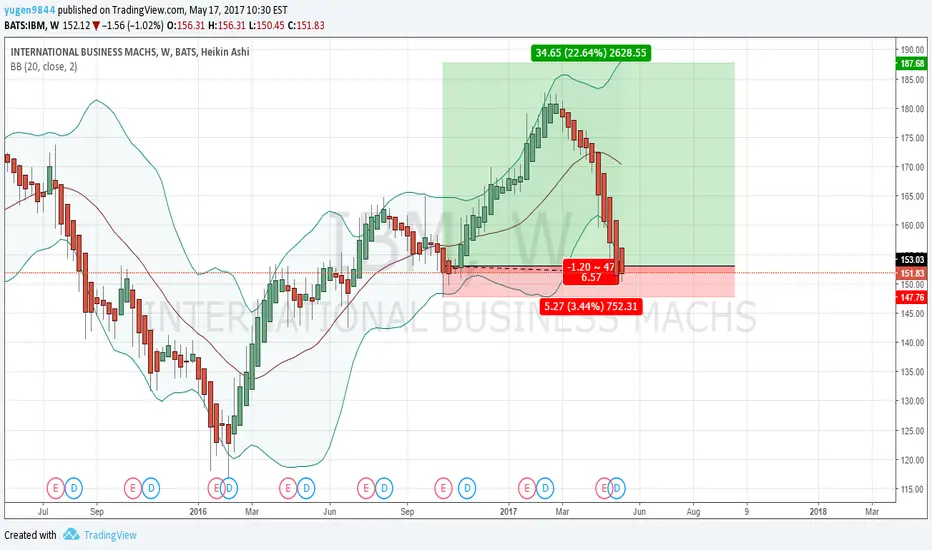
IBM monthly chart If history repeats itself, and if I am correct in liking how IBM is setting itself up , they should see a price dip below $140 by YE2016 then look for big rebound in early 2018 back above $175 at least. Its a long-term play, but if it sets up the its a nice gain.

Perfect zone to buy upthis is a perfect setup for other companies or major share holders to buy in a DOWJones listed stock.
IBM: WHAT TO DO WITH BIG BLUE?FUNDAMENTAL PICTURE: CHALLENGING
With a consensus recommendation to HOLD and an average consensus price upside of only +10%, it seems the average analyst is not too keen on owning this name. This could be explained by the diminishing topline (5-yr CAGR -5.65%) or the decreasing bottom line (5-yr CAGR -1.0%), or a combination of both reinforced by ROE trending down (albeit from a high level), as well as negative cash-flow growth. In all cases, the market seems to believe that this is not an asset to own on any fundamental basis.
TECHNICAL PICTURE: QUITE POOR
IBM Looks technically weak on most time frames, with most technical indicators negative. In particular, mind the negative cross-over of MA20/MA50 in December 2014 and MA20/MA100 in March 2016. Main support from here seems to be the MA200 at $128/share on the monthly chart, corresponding nearly exactly to the bottom of the descending wedge (red line on the long term chart below). Intermediate levels down are $148 / $142 / $138. On the medium-term weekly chart, IBM looks like it reached an intermediary top at $182.79 on February 16 of this year. Since then, the stock has been selling-off hard on significant, above-average volume. On the daily chart, IBM’s weakness is confirmed and reinforced by multiple and significant gaps down: -4.87% on April 19 and -3.47% on May 5. The former corresponds to the most recent earnings disappointment, when the stock gapped down in 4x average volume, and failed to properly recover. The stock currently looks mildly oversold on the medium-term chart and much oversold on the daily chart (RSI = 12.85).
FLOW PICTURE: SCARY?
When Mr. Buffett sells out of his structural position on Big Blue, this sends a negative signal and bodes one question: If Mr. Buffett does not believe in it, should we? Most of the time, holding contrarian positions in the face of influential institutional investors has proven dangerous, if not painful. This a red flag for any ownership of this stock.
MACRO PICTURE: DOWN
The indices are currently looking toppish, and signs of divergence are starting to appear between the technology leaders (NASDAQ) and the rest of the market (SPX, DJIA). This lack of breadth with technology thrusting forward against all odds begs for some adjustment. Will it be a time consolidation, a downward adjustment (selloff), or a coordinated move above the current resistances (breakout)? As we do not have the answer to this question, proper risk management tells us to continue to expect a consolidation until the latter and third scenario (breakout) is proven true. In the meantime, we would like to remain very selective with any new positions. In particular, it makes sense to be particularly careful with weak stocks, as they are likely to become weaker should the market consolidate.
CONCLUSION ON IBM: STAY AWAY OR USE OPTIONS
In conclusion, the main elements going for IBM at the moment are the fact that its valuation is low relative to the market, and that it looks oversold, none of which is reason enough to build a position in it at this time - Valuations can go lower, and an oversold condition can persist for a long time. There appears to be more attractive assets to own in the current market than Big Blue. For those looking to benefit from an eventual short-term rebound in the stock, prefer the use of options in order to minimize risk and exposure. In particular, note that the volatility has remained quite low even in the context of the stock going down, hence encouraging the purchase of options. For about $1/share, one can buy a slightly OTM call which should appreciate in case the stock pops (even though it remains unclear at this time what could trigger such a pop).

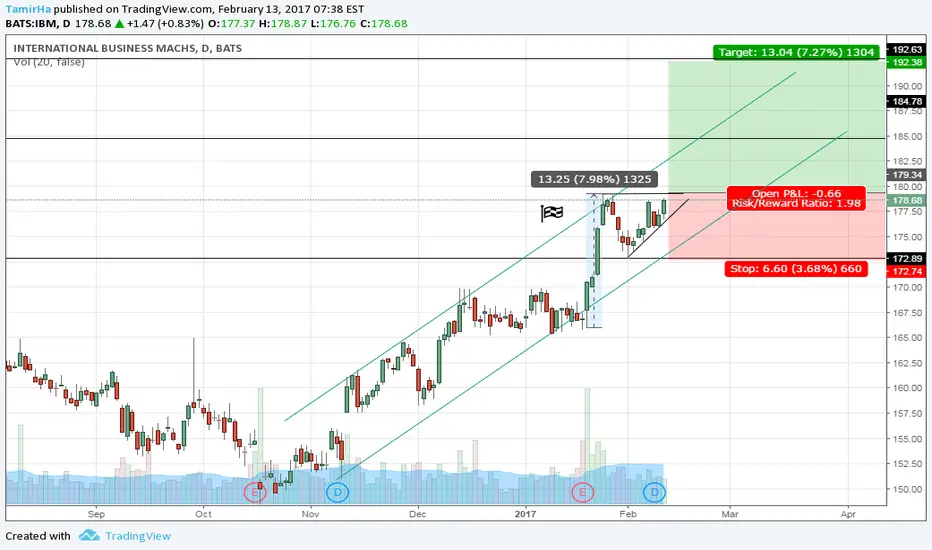
IBM - BullishIBM stock is trending up
sort term price created a rising channel with a continuation bull flag
the company posted better then expected earnings and paid dividends
long term hold is an option but here i present a trade with a good P/L (2/1)
Might be a good day to pick up some IBM after the panic selling So Mr Buffet dumped his shares of IBM and the flocks are selling at a discount. Wouldn't be surprised if Ole Country Buffet bought this dip himself!
Looking for a big long wick closing above the old neckline with volume.
or
A dip in price at open that reverse early in the morning and then blasts past the opening price with some volume.
Or
Just watch it drop like a rock and never return!

IBM Bullish Long TermGap fill trading. Simply wait for bottom to form and enter on a retracement for gap target.

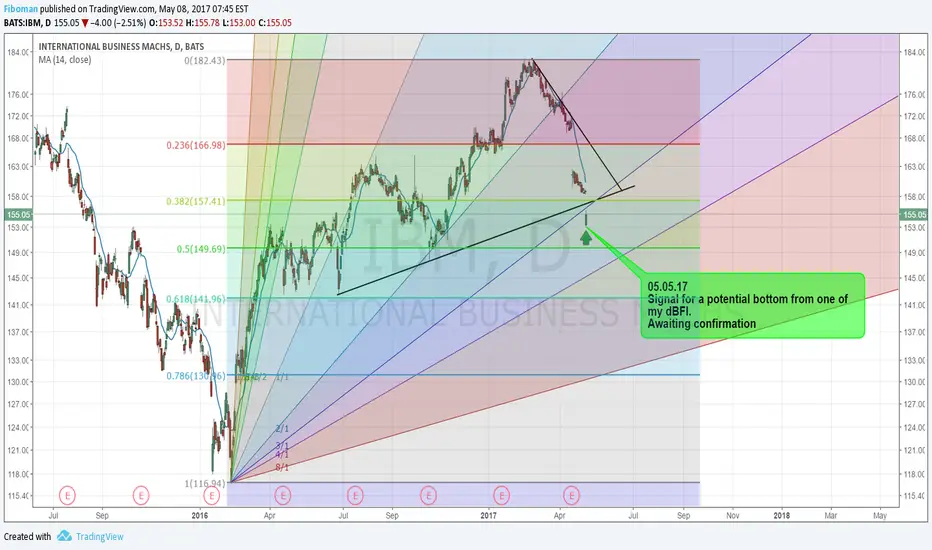
IBM - POTENTIAL BOTTOM05.05.17
Signal for a potential bottom from one of my dBFI.
Awaiting confirmation

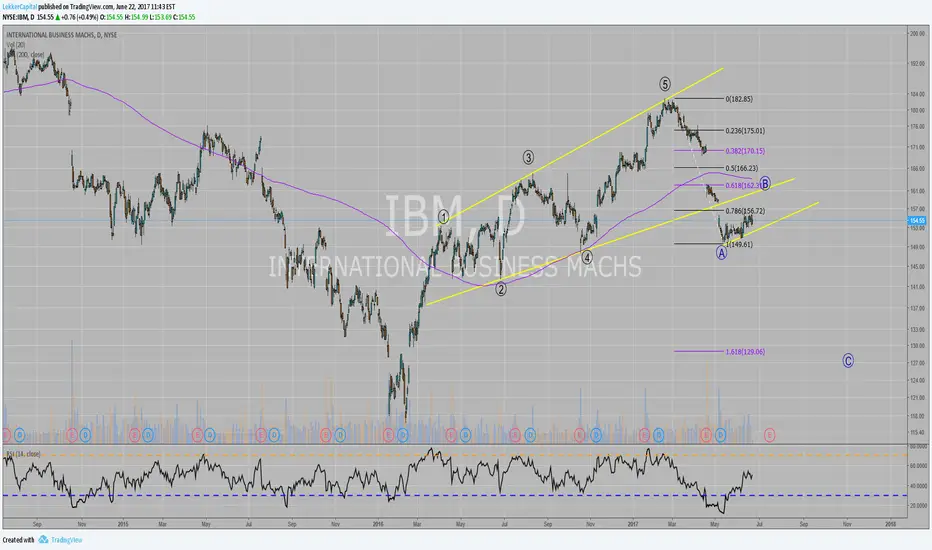
Possible completion of Wave 2, setup for Wave 3 LONGIt seems we may have a confirmation of the end of a Wave 2, ready to trade a Wave 3 LONG.
TDI in this instance shows almost oversold position and would correspond directly with the price action and structure.
The Mustard, Ketchup, Mayo and Blueberry EMAs have also all crossed (note Crossing of Ketchup and Blueberry EMAs) suggesting an imminent reversal to go LONG.
Entry on this stock would be on breakout of Structure as shown by the trendline breakout point (in RED).
Caution always advised.
----------------------------------------------------------------------------------------------------------------------------------------------------------
DISCLAIMER: This chart is for sharing and educational purposes only and is not intended to be a signal service or similar.
This chart analysis is only provided as my own opinion, based on my own analysis and comes with absolutely no warranty that this analysis is correct, whatsoever. Do not trade this chart if you do not have your own strategy. Trade only with your own strategy at your own risk.
Plan your trade and trade your plan... and IF in doubt, stay out.
.....::::: If you like this chart, please click on the THUMBS UP ! :::::.....
----------------------------------------------------------------------------------------------------------------------------------------------------------
