Next report date
—
Report period
—
EPS estimate
—
Revenue estimate
—
6.00 EUR
3.22 B EUR
32.77 B EUR
154.69 M
About IMPERIAL OIL
Sector
Industry
CEO
John R. Whelan
Website
Headquarters
Calgary
Founded
1880
FIGI
BBG000D0V9X4
Imperial Oil Ltd. engages in the exploration, production, and sale of crude oil and natural gas. It operates through the following business segments: Upstream, Downstream, Chemical, and Corporate and Other. The Upstream segment includes the exploration and production of crude oil, natural gas, synthetic oil, and bitumen. The Downstream segment focuses on refining crude oil into petroleum products. The Chemical segment manufactures and markets hydrocarbon-based chemicals and chemical products. The Corporate and Other segment covers assets and liabilities that do not specifically relate to business segments. The company was founded on September 8, 1880 and is headquartered in Calgary, Canada.

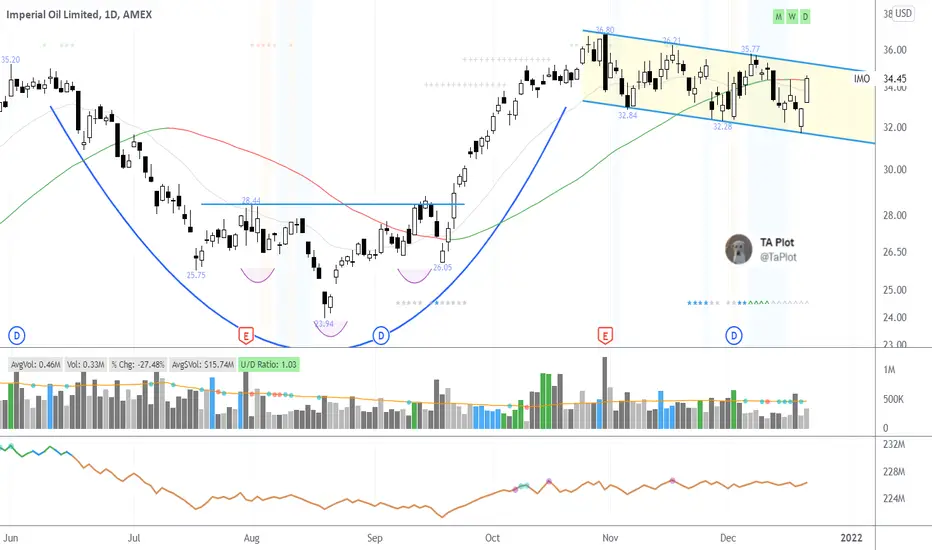
IMO: Ascending Triangle, not confirmed (59,64%)(24/1000)(24/1000)
Ascending Triangle for IMO (chart on left)
Not confirmed.
Possible 59,64% gains.
This is solidified by the fact the SPN (energy sector, chart on right) is also building into an ascending triangle (not confirmed) with a possible 41,62% gain.
Now for the analysis of IMO:
Pros:
1- Bulli

$IMO with a Bullish outlook following its earnings #Stocks The PEAD projected a bullish outlook for $IMO after a Negative over reaction following its earnings release placing the stock in drift C with an expected accuracy of 71.43%.

IMO - double top patternWhat we can see on the chart is a double top pattern.
We expect that the price is going to move downwards, once it broke below the neckline you can enter short with a sell limit order.
Do not forget to put a stop loss above the double top to protect your capital.

$IMO with a Bullish outlook following its earnings #Stocks The PEAD projected a Bullish outlook for $IMO after a Positive Under reaction following its earnings release placing the stock in drift A.

IMO Strong Breakout to UpsideTwo big patterns can be identified on chart, one ascending one descending. Both are bullish.
Upon completion a large bull run ensues.
The previous chart pattern has just finished forming and breakout further up (green arrow) is occurring

$IMO with a Bearish outlook following its earnings #Stocks The PEAD projected a Bearish outlook for $IMO after a Positive over reaction following its earnings release placing the stock in drift B with an expected accuracy of 80%.

$IMO 7 Months Cup with HandlePretty neat chart on $IMO
*7 month coup w/ handle
*Cup base was a head & shoulders bottom
*Handle taking on the shape of a 2 months bull flag
Need to give us a tight pivot to anchor risk around.
Watching but Its not ready just yet.
$IMO 6 Months Cup with Handleanother on in the oil sector is $IMO with its 6 months cup and a handle in the shape of a bull flag. Making it to my primary list along side $DEN and $WLL
IMO - Poised for moveIMO is the best looking oil company chart that I could find. The weekly pattern shows the possibility of a three week test of the low. This support level includes the 40 week moving average and the .326 fib retracement level.
The wave structure suggests that we may be in the fourth wave of an imp

See all ideas
Summarizing what the indicators are suggesting.
Neutral
SellBuy
Strong sellStrong buy
Strong sellSellNeutralBuyStrong buy
Neutral
SellBuy
Strong sellStrong buy
Strong sellSellNeutralBuyStrong buy
Neutral
SellBuy
Strong sellStrong buy
Strong sellSellNeutralBuyStrong buy
An aggregate view of professional's ratings.
Neutral
SellBuy
Strong sellStrong buy
Strong sellSellNeutralBuyStrong buy
Neutral
SellBuy
Strong sellStrong buy
Strong sellSellNeutralBuyStrong buy
Neutral
SellBuy
Strong sellStrong buy
Strong sellSellNeutralBuyStrong buy
Displays a symbol's price movements over previous years to identify recurring trends.
Related stocks
Frequently Asked Questions
The current price of IMP is 64.34 EUR — it has increased by 1.21% in the past 24 hours. Watch IMP. OIL stock price performance more closely on the chart.
Depending on the exchange, the stock ticker may vary. For instance, on FWB exchange IMP. OIL stocks are traded under the ticker IMP.
IMP stock has risen by 0.35% compared to the previous week, the month change is a 5.65% rise, over the last year IMP. OIL has showed a −0.83% decrease.
We've gathered analysts' opinions on IMP. OIL future price: according to them, IMP price has a max estimate of 75.59 EUR and a min estimate of 51.25 EUR. Watch IMP chart and read a more detailed IMP. OIL stock forecast: see what analysts think of IMP. OIL and suggest that you do with its stocks.
IMP stock is 1.12% volatile and has beta coefficient of 1.40. Track IMP. OIL stock price on the chart and check out the list of the most volatile stocks — is IMP. OIL there?
Today IMP. OIL has the market capitalization of 32.36 B, it has increased by 0.74% over the last week.
Yes, you can track IMP. OIL financials in yearly and quarterly reports right on TradingView.
IMP. OIL is going to release the next earnings report on Aug 1, 2025. Keep track of upcoming events with our Earnings Calendar.
IMP earnings for the last quarter are 1.62 EUR per share, whereas the estimation was 1.39 EUR resulting in a 16.23% surprise. The estimated earnings for the next quarter are 0.98 EUR per share. See more details about IMP. OIL earnings.
IMP. OIL revenue for the last quarter amounts to 8.04 B EUR, despite the estimated figure of 8.65 B EUR. In the next quarter, revenue is expected to reach 7.75 B EUR.
IMP net income for the last quarter is 827.24 M EUR, while the quarter before that showed 822.29 M EUR of net income which accounts for 0.60% change. Track more IMP. OIL financial stats to get the full picture.
Yes, IMP dividends are paid quarterly. The last dividend per share was 0.47 EUR. As of today, Dividend Yield (TTM)% is 2.54%. Tracking IMP. OIL dividends might help you take more informed decisions.
IMP. OIL dividend yield was 2.71% in 2024, and payout ratio reached 26.59%. The year before the numbers were 2.57% and 22.85% correspondingly. See high-dividend stocks and find more opportunities for your portfolio.
As of May 29, 2025, the company has 5.1 K employees. See our rating of the largest employees — is IMP. OIL on this list?
EBITDA measures a company's operating performance, its growth signifies an improvement in the efficiency of a company. IMP. OIL EBITDA is 5.28 B EUR, and current EBITDA margin is 16.91%. See more stats in IMP. OIL financial statements.
Like other stocks, IMP shares are traded on stock exchanges, e.g. Nasdaq, Nyse, Euronext, and the easiest way to buy them is through an online stock broker. To do this, you need to open an account and follow a broker's procedures, then start trading. You can trade IMP. OIL stock right from TradingView charts — choose your broker and connect to your account.
Investing in stocks requires a comprehensive research: you should carefully study all the available data, e.g. company's financials, related news, and its technical analysis. So IMP. OIL technincal analysis shows the buy rating today, and its 1 week rating is buy. Since market conditions are prone to changes, it's worth looking a bit further into the future — according to the 1 month rating IMP. OIL stock shows the buy signal. See more of IMP. OIL technicals for a more comprehensive analysis.
If you're still not sure, try looking for inspiration in our curated watchlists.
If you're still not sure, try looking for inspiration in our curated watchlists.