INTC re entry August 3rd 2023INTC is giving us re entry and target would be $38 and then $40. DO NOT TRADE OPTIONS.
INL trade ideas

INTC - Bullish CUP (and handle?)INTC first broke out of it's base neckline @30.50 (as well as it's 200 day Moving Average) on 29 March. However, its movement has been very erratic since.
Last Friday's post earning's strong gap up changes the picture considerably IMO as it has now completed a "CUP" formation (a bullish pattern with higher odds of success).
2 possible scenario could happen next:
1. it breaks out of the CUP with hardly any pullback (ie no "handle" being formed) or,
2. it begins to from a "handle", which is likely to be a shallow 38.2% fib retracement towards 34.90 where it fills the recent gap. This level is just arbitrary but in any case, a pullback would provide a less risky opportunity to long (or add to) the stock with a stop just slightly below 33 (61.8% fib retracement).
When the stock eventually breaks out of $39, then the next target @ $43 is in sight, although expect it to move in a zig zag fashion up.
p/s targets are for shorter term traders, who may prefer to take profits and look for opportunity again during the next pullback.
Disclaimer: Just my 2 cents and not a trade advice. Kindly do your own due diligence and trade according to your own risk tolerance and don't forget that money management is important! Take care and Good Luck!

Technical and digital analysisWe notice that we are in a major correction to the upside, and that at the end of the correction we are waiting for the sellers' momentum to weaken and enter long-term buying

INTEL CORPORATION still bullish market for expect
Hi viwers, INTC in last periods bullish trend we are can see, here now zone breaked, showed strong volumen, for next peridos still bullish trend here expecting to see.
TP1: 41.41
TP2: 44.40

INTEL time to start booming
Hi viewers, INTC here strong bullish porgress technically watched in next periods to expect
TP1:31
TP2:33
TP3:35


$INTC Double Top Test After EarningsNASDAQ:INTC Double Top Test After Earnings, Intel reported earnings on July 27, 2023. The company beat analyst expectations for earnings per share, but revenue came in below expectations. Intel also lowered its guidance for the third quarter of 2023. A double top is a technical chart pattern that often points to the possibility of a downtrend reversal from an uptrend. It is formed when the price of a security reaches a high point twice, but fails to break through the previous high.
The double top pattern is considered a bearish reversal pattern because it suggests that the bulls have lost momentum and that the bears are gaining control.
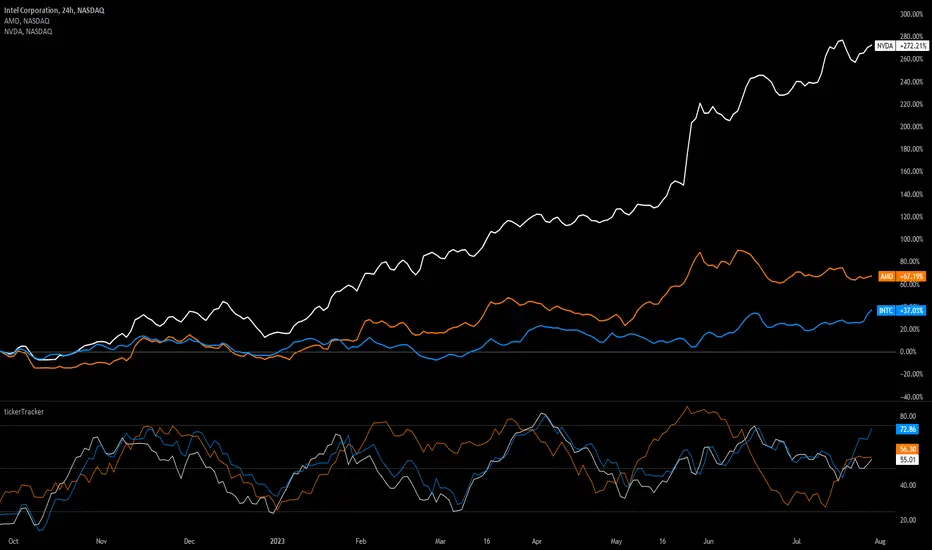
INTC comparisonHere's an INTC, NVDA & AMD comparison chart with the tickerTracker MFI Oscillator set to 20 on the 1 day (24hr ext.) chart. As you can see INTC MFI level has taken the lead since July 24th heading into it's earnings date yesterday on the 27th. AMD earnings are on 8/1 and NVDA earnings are on 8/23.
Intel (INTC) reported earnings of 0.13 per share on revenue of 12.95 billion for Q2 ending June 2023. The consensus estimate was a loss of -0.04 per share on revenue of 12.08 billion. The company beat expectations while revenue fell 15.48% compared to the same quarter a year ago. INTC said it expects Q3 earnings of approximately 0.20 per share for the quarter ending September 30, 2023.
INTC options data:
8/18 expiry
Put Volume Total 22,832
Call Volume Total 72,363
Put/Call Volume Ratio 0.32
Put Open Interest Total 103,401
Call Open Interest Total 159,612
Put/Call Open Interest Ratio 0.65
9/15 expiry
Put Volume Total 16,482
Call Volume Total 16,874
Put/Call Volume Ratio 0.98
Put Open Interest Total 154,918
Call Open Interest Total 211,404
Put/Call Open Interest Ratio 0.73
10/20 expiry
Put Volume Total 4,969
Call Volume Total 10,289
Put/Call Volume Ratio 0.48
Put Open Interest Total 88,592
Call Open Interest Total 184,949
Put/Call Open Interest Ratio 0.48
NVDA options data:
8/18 expiry
Put Volume Total 43,779
Call Volume Total 89,819
Put/Call Volume Ratio 0.49
Put Open Interest Total 184,560
Call Open Interest Total 258,967
Put/Call Open Interest Ratio 0.71
9/15 expiry
Put Volume Total 12,738
Call Volume Total 25,826
Put/Call Volume Ratio 0.49
Put Open Interest Total 316,010
Call Open Interest Total 356,213
Put/Call Open Interest Ratio 0.89
10/20 expiry
Put Volume Total 9,010
Call Volume Total 7,301
Put/Call Volume Ratio 1.23
Put Open Interest Total 73,460
Call Open Interest Total 68,525
Put/Call Open Interest Ratio 1.07
AMD options data:
8/18 expiry
Put Volume Total 10,127
Call Volume Total 31,498
Put/Call Volume Ratio 0.32
Put Open Interest Total 151,799
Call Open Interest Total 236,005
Put/Call Open Interest Ratio 0.64
9/15 expiry
Put Volume Total 8,489
Call Volume Total 30,115
Put/Call Volume Ratio 0.28
Put Open Interest Total 181,467
Call Open Interest Total 154,803
Put/Call Open Interest Ratio 1.17
10/20 expiry
Put Volume Total 4,979
Call Volume Total 18,786
Put/Call Volume Ratio 0.27
Put Open Interest Total 72,745
Call Open Interest Total 107,177
Put/Call Open Interest Ratio 0.68
$INTC with a neutral outlook following its earnings #StocksThe PEAD projected a neutral outlook for NASDAQ:INTC after a negative over reaction following its earnings release placing the stock in drift C with an expected accuracy of 77.78%.

INTC STOCK PRICE SOARS APPROXIMATELY 7% AFTER REPORTIt happened at yesterday's postmarket. At the same time, at the peak, the price of INTC stock reached a maximum of 2023. Here are the key points voiced by Intel CEO Pat Gelsinger:
→ Sales of server chips will only recover in Q4.
→ The company is prepared to take advantage of all the opportunities that open up with the development of AI.
→ The company is focused on implementing the Smart Capital strategy to support sustainable growth and financial discipline.
Investors were enthusiastic about the fact that the company became profitable, earning USD 1.5 billion (in the second quarter of 2022, a loss of USD 0.5 billion was recorded).
According to MarketWatch, analysts believe that Intel can benefit from the AI revolution, but it is not yet clear if Gelsinger can avoid the mistakes of his predecessors.
The INTC stock chart shows that the price is moving within an ascending channel in 2023. Today, trading is likely to open near its upper border. And now the bulls will have to try to keep the progress made, gaining a foothold above the USD 35.00-36.50 zone, which originates in 2022 and acted as resistance during 2023.
According to the WSJ, the average target price for INTC shares is around USD 33.63, but after yesterday's report, it is likely to be revised upwards.
This article represents the opinion of the Companies operating under the FXOpen brand only. It is not to be construed as an offer, solicitation, or recommendation with respect to products and services provided by the Companies operating under the FXOpen brand, nor is it to be considered financial advice.

$INTC to rally 180%?Intel is still a major player in semiconductor space and could benefit greatly from Ai boom.
I believe major rally for NASDAQ:INTC will take place over the next few years and I target 180% recovery from recent lows. It could be shaky in the short term given uncertainty in the markets but I believe it's good long term investment.

INTC's GROWINGINTC just had a triple bottom on a weekly timeframe, and I have just made a super late entry for a long position after it's pullback from the neckline. There will be another safe entry after the price breaks out through the upper part of the ascending triangle.

Intel: Go for it! 💪 Since the low of wave x in orange, Intel has already shown strong upwards movement and should soon conquer the resistance at $37.11, heading for the compound consisting of the turquoise zone between $41.59 and $43.13 and the orange zone between $42.32 and $43.63. There, the share should complete wave 4 in turquoise and return below $37.11 afterward. However, there is a 34% chance that Intel could shift southwards earlier already and drop below the support at $26.86, triggering further descent below $24.55. In that case, we would consider wave alt.4 to be finished by now.

INTC 2H 2023 INTC following the channel, if market continues moving the way it's moving, it has a decent path to revisit 40. Considering recent performance from the semi's guessing this should join the group soon. Let's see if it starts moving while the rally is still going.
Crazy to see moves from the likes of TSM, NVDA and AMD relative to INTC.

$INTC , Monday , July 17 Gameplan! NASDAQ:INTC ,
On the most recent trading day, Friday, July 14, 2023, the stock price of Intel experienced a decline of -2.13%, dropping from $33.87 to $33.15. Throughout the day, the stock exhibited a fluctuation of 2.64%, reaching a low of $33.00 and a high of $33.87. Over the specified period, the stock price has displayed fluctuations, resulting in a 0.73% gain over the past two weeks. Notably, the volume decreased in tandem with the stock, which is generally considered a positive sign as volume should align with the stock's movement. Specifically, on the last day, the trading volume witnessed a decrease of -242 thousand shares. In total, approximately 30 million shares were bought and sold, with a total value of approximately $987.65 million.
The stock is currently positioned within the center of a substantial and robust upward trend in the short term, indicating a potential for further growth within this trend. Considering the prevailing short-term trajectory, it is anticipated that the stock will experience a 13.10% increase over the next three months. Moreover, there is a 90% probability that the stock will maintain a price range between $33.66 and $42.59 at the conclusion of this three-month period.

Bullish Alert : INTCThe Bearish combo was not confirmed, and now the price created a new Bullish Alert with bullish crossover.
A good price action may come at about $34.5
Intel’s Rally Might Be FadingIntel has struggled to keep pace with chip makers like Nvidia and Advanced Micro Devices for years. Now after an attempted turnaround, the bears may be returning.
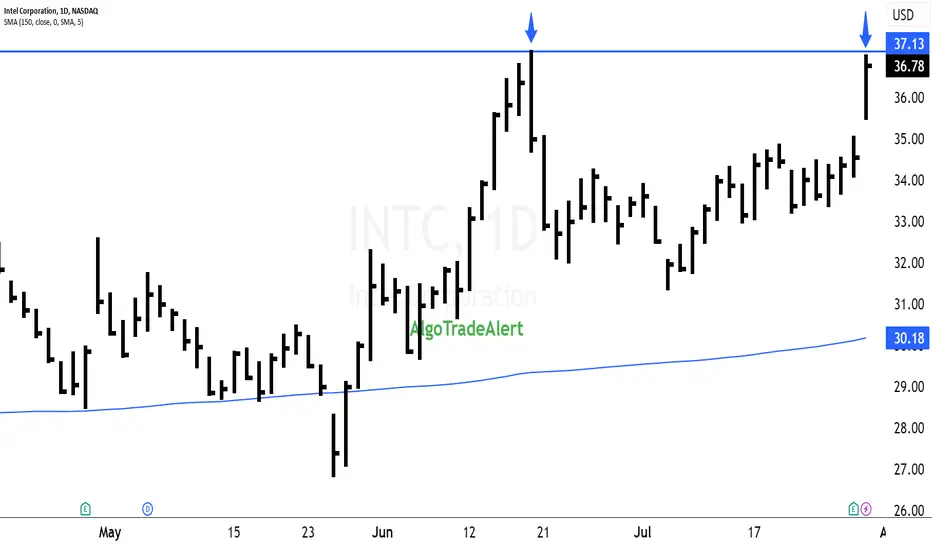
The first pattern on today’s chart is the three-week rally in late May and early June. INTC halted at $36.96, its highest closing price since the stock gapped lower on July 29, 2022. A test and rejection of that zone could make traders think the long-term downtrend remains in effect.
Second is the triangle immediately after the drop. The consolidation pattern resolved to the downside.
Next, the eight-day exponential moving average (EMA) crossed under the 21-day EMA for the first time since May 31. MACD has also fallen for almost two weeks. Is the shorter-term direction getting more bearish?
Finally, INTC is more than $2 above its 200-day simple moving average (SMA) and $7 above its 52-week low. That could make traders see more room to the downside.
TradeStation has, for decades, advanced the trading industry, providing access to stocks, options, futures and cryptocurrencies. See our Overview for more.
Important Information
TradeStation Securities, Inc., TradeStation Crypto, Inc., and TradeStation Technologies, Inc. are each wholly owned subsidiaries of TradeStation Group, Inc., all operating, and providing products and services, under the TradeStation brand and trademark. TradeStation Crypto, Inc. offers to self-directed investors and traders cryptocurrency brokerage services. It is neither licensed with the SEC or the CFTC nor is it a Member of NFA. When applying for, or purchasing, accounts, subscriptions, products, and services, it is important that you know which company you will be dealing with. Please click here for further important information explaining what this means.
This content is for informational and educational purposes only. This is not a recommendation regarding any investment or investment strategy. Any opinions expressed herein are those of the author and do not represent the views or opinions of TradeStation or any of its affiliates.
Investing involves risks. Past performance, whether actual or indicated by historical tests of strategies, is no guarantee of future performance or success. There is a possibility that you may sustain a loss equal to or greater than your entire investment regardless of which asset class you trade (equities, options, futures, or digital assets); therefore, you should not invest or risk money that you cannot afford to lose. Before trading any asset class, first read the relevant risk disclosure statements on the Important Documents page, found here: www.tradestation.com .

DB & UP CHANNELINTC has completed a double bottom / box pattern and is ranging within the up channel. There are D1 gaps to fill and an LVA on the way up. Next major resistance is around $44.

INTC LONGShort term entry: $32
Short term sell: $36
Long term entry: $32
Long term sell: $70
I say we see $70 in 6-8 months
NASDAQ:AMD and NASDAQ:NVDA have nearly tripled in price since October. AMD is less leveraged than INTC but INTC still doesn't hold that much debt, especially relative to its industry competitors. Well set up for growth in the future.

Intel due to rise.Fibonacci retracement
MA 50 and 200 , 50 above the 200
Price is all time low
It is expected to bounce back
Lookout for earnings too.

Intel Corporation ($INTC) LongThe NASDAQ:INTC 10/20 38/44C spread were active today trading over 30,000x. Someone is bullish the name and anticipating good earnings. Target = 40+

$INTC, Bearish AlertBearish crossover + bearish alert.
The current price action shows a possible reversal of this wave as the price went too below the ema 50h.
Waiting for a move below $32
Intel downtrend channelThe price of Intel stock hit the top of a parallel channel and got sold off quite rapidly. I see this as evidence of a continuing downtrend for this semiconductor stock.
