$INTC - gimme that baseINTC is setting up a nice base.
I have alerts for $55 to add. Right now I am holding the right number of commons for me.
If the base completes, I think we go into cup and handle pattern. it's holding fairly steady with all the SPY whiplash over the last few weeks.
Worth a watch.
INL trade ideas
LongIntel seems to have made progress in the energy consumption of the new CPU in the upcoming alder Lake 12. The graphic display adjustment seems to have been completed, which has been adjusted around 0.618 for some time. It is expected to start three waves and rise for a period of time. Intel has been underestimated recently. After driving away the previous CEO, it seems to be back on track and begin to pay attention to technology and technology.

INTC: Buy orderAll trade in sell order/buy order, might not trigger, cancel if the price has run too far.

Intc H&SHeaded back to 51.50 with this H&S .
I'd look for a bounce There which would be bottom of this channel..
All of the chip sectors have loss there support (Smh, Soxx,Soxl) ... this could get ugly if 51$ doesn't

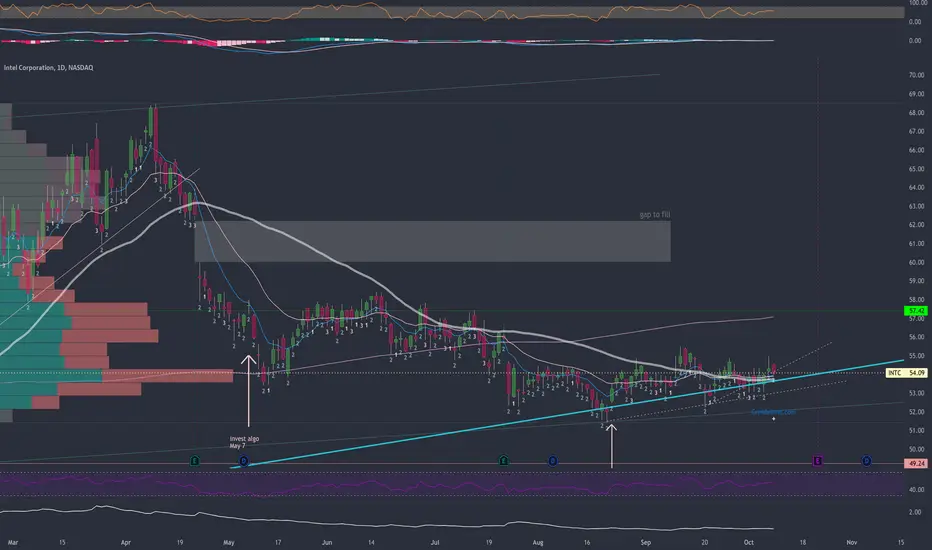
Bullish Divergence for IntelA sign of a trend change. From here I think we'll try to fill the gap.
Do your own DD - not trade advice.
Good luck!

Gap fill for earnings (before or after?)Gap will be filled on the daily. "When" is the question.
Thoughts?
Good luck to all.

INTC - ShortI am shorting INTC
Sitting well below its 200DMA
At the top of a 60-day descending channel
At the top of a 30-week descending channel
All sorts of moving average resistance above (10 day, 50 day, 200 day, 10 week, 30 week)
To this new trader, this stock looks ugly.
Target: 47.50ish (will sell 1/2 at 51.50)
Stop: 54.28 (a close above 50dma)

ABC BullishKind of hard to be bullish on anything after a day like today. On the positive side, a stop would be close by.
INTC was in a small wedge or pennant but fell out today. This could fall further but just does not look like it will go too much lower. But who knows? I suppose the next few days will let us know.
Possible tight inverse head and shoulders.
No recommendation

INTC Daily TimeframeSNIPER STRATEGY (new version)
It works ALMOST ON ANY CHART.
It produces Weak, Medium and Strong signals based on consisting elements.
NOT ALL TARGETS CAN BE ACHIEVED, let's make that clear.
TARGETS OR ENTRY PRICES ARE STRONG SUPPORT AND RESISTANCE LEVELS.
ENTRY PRICE BLACK COLOR
TARGETS GREEN COLOR
STOP LOSS RED COLOR
DO NOT USE THIS STROTEGY FOR LEVERAGED TRADING.
It will not give you the whole wave like any other strategy out there but it will give you a huge part of the wave.
The BEST TIMEFRAMES for this strategy are Daily, Weekly and Monthly however it can work on any timeframe.
Consider those points and you will have a huge advantage in the market.
There is a lot more about this strategy.
It can predict possible target and also give you almost exact buy or sell time on the spot.
I am developing it even more so stay tuned and start to follow me for more signals and forecasts.
START BELIEVING AND GOOD LUCK
HADIMOZAYAN

INTEL CORP PE ratio and 100 days EMA
The P/E multiple is calculated as the current market price divided by the earnings per share (eps). That ratio shows us how many times we pay to get one money unit of earnings or how many years are needed to get my money back if the earnings stay constant.
INTC has pretty good PE ratio compared to the overall market.
Waiting to cross the 100 days MA and then pull the trigger!

INTEL Daily TimeframeSNIPER STRATEGY
This magical strategy works like a clock on almost any charts
Although I have to say it can’t predict pullbacks, so I do not suggest this strategy for leverage trading.
It will not give you the whole wave like any other strategy out there but it will give you huge part of the wave.
The best timeframe for this strategy is Daily, Weekly and Monthly however it can work any timeframe above three minutes.
Start believing in this strategy because it will reward believers with huge profit.
There is a lot more about this strategy.
It can predict and also it can give you almost exact buy or sell time on the spot.
I am developing it even more so stay tuned and start to follow me for more signals and forecasts.

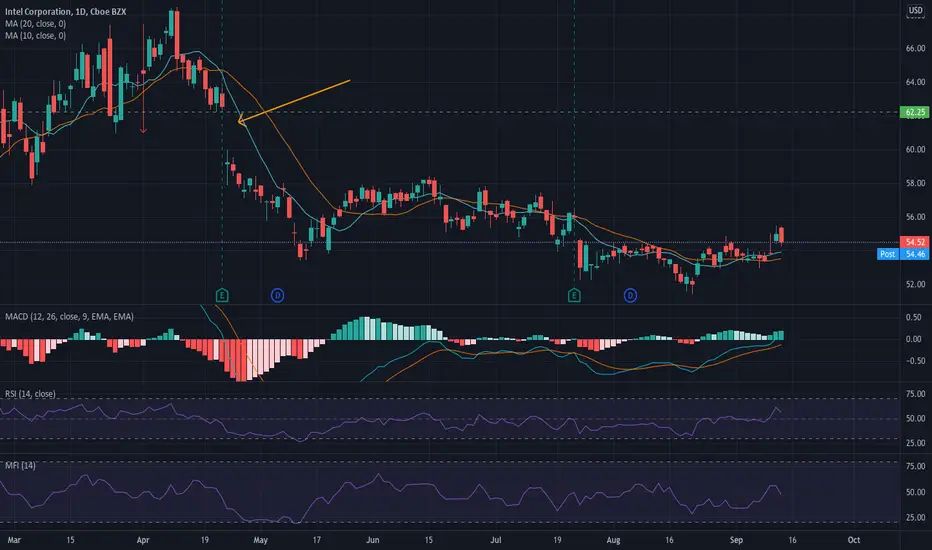
Intel GapIntel formed a GAP on April 22 that havent been closed yet at $62.25
Intel have a history of GAP's and sometimes it took over 6 months to close it.
Can INTEL Bulls do it?MACD Curling, RSI trending up. If Intel bulls can break the 200 Day MA, they can take it higher.

Intel (INTC) the company has very attractive corporate multiples with a P/E around 12, debt under control and a good dividend yield. The problem is that the market does not like it, but an investment at these prices, especially if it falls below $ 50, could prove to be very interesting in the medium or long term. 75% of microchips are manufactured in Asia, and that is THE problem: the supply chain. Intel is the biggest American chipmake, its most advanced fab is outside Phoenix.
Earnings per share ought to increase at a high single-digit clip, on average, over the pull to 2024-2026. These shares are worthy of consideration by investors of all ilks; long-term riskad justed total return potential is wide.
2021 Net Profit (est.) 19.4 B.
2021 Total Debt 30.0 B.

MARKET ALPHA WATCHLIST - INTCHey Everyone!
I hope everyone is having a blessed day. Today I'm posting a symbol from our watchlist. Spotted in the options market. We are watching INTC to see more strength and break above this trendline and possible downward trend. These are the levels to watch over the next few weeks whether long or or short.
NASDAQ:INTC

Undervalued INTEL (Long)Intel has underperformed for a while now and it's price reflects that. However, the chip industry is on fire atm and INTEL still remains the largest Chip producer in the world.
----------
Price action is currently stuck in a descending wedge (Bullish) with a bearish rejection at the recent resistance. Watch carefully to what happens at the wedge support around 51.70 (1). With strong support we may see it test that wedge resistance again and ideally break through to the levels indicated at 2, 3 and 4.
-----------
Negative scenario: Wedge support is broken and we head to LONG term (Sep, 2018) support around 45-46 level.
----------
Not financial advice - Do you own DD.
---------
Let me know your thoughts and GL!

INTEL : FUNDAMENTAL ANALYSIS + NEXT TARGET LEVEL 🔔Intel was hit hard by rival Advanced Micro Devices in the x86 (central processing unit) processor market, losing share in servers and PC processors thanks to the latter's technological advantage.
But now Chipzilla has aimed at AMD as well as Nvidia, entering the multi-billion dollar discrete graphics processor (GPU) market.
Intel recently announced that the first generation of Arc discrete graphics cards will be available in the first quarter of 2022. Chipzilla claims that these cards will "deliver high-performance gaming, immersive visual effects, seamless streaming, and game creation."
Intel's first-generation discrete graphics cards, codenamed Alchemist, will include ray tracing technology and artificial intelligence-based supersampling. Competitors AMD and Nvidia already equip their cards with such technologies, and gamers willingly buy their graphics processors of the latest generation to improve gameplay. Moreover, Intel plans to have three more generations of Arc graphics cards after Alchemist - Battlemage, Celestial, and Druid, which means that the company plans to consistently improve its GPUs over time.
All of this indicates that Intel is serious about taking a rightful place in the discrete GPU market, which could herald a much-needed turn in the company's fortunes and help stop the recent decline in its financial performance. Moreover, there are several reasons why Chipzilla could take market share away from AMD and Nvidia after launching its cards.
First, the Alchemist GPUs will be based on Taiwan Semiconductor Manufacturing's N6 6-nanometer (nm) technology node. Current AMD RDNA 2 gaming GPUs are based on 7nm process technology, while Nvidia's Ampere gaming GPUs are based on Samsung's 8nm process technology. AMD is expected to switch to TSMC's 6nm process when it releases its next generation of RDNA 3 graphics cards. Meanwhile, rumors suggest that Nvidia could move to the 5nm process when it releases its next-generation cards, codenamed Ada Lovelace, in 2022.
Identical manufacturing processes mean Intel could find itself on equal footing with Nvidia and AMD on the technology front. Thus, Chipzilla enters the GPU market with a solid background that could make it a viable third choice for gamers who have trouble buying graphics cards because Nvidia and AMD can't produce them in sufficient quantity.
That brings us to the second reason Intel may be in the discrete graphics processor market: Nvidia and AMD can't produce enough cards to meet the huge end-market demand.
Nvidia CEO Jensen Huang explained this during the August financial results report:
"The demand for RTX is incredible. ... And now we've zeroed in on the installed base, and Ampere has gotten off to an incredible start, becoming the best-selling GPU architecture in our company's history. And yet, we've only updated about 20% - less than 20% of our total installed base."
Similarly, AMD is also witnessing strong demand, which is why CEO Lisa Su recently noted that supply will remain tight despite the company's efforts to increase capacity.
Intel can fill the void to some extent by offering a viable GPU alternative for Nvidia and AMD. It could poach potential AMD and Nvidia customers and get a good start in the discrete graphics card market if it can produce enough units. So don't be surprised if Intel does well in the GPU market next year, which will be good for the chipmaker due to the wide end-market opportunities.
Intel intends to be in the discrete graphics card business for a long time, as the company has unveiled its horizon, which currently includes four generations of GPUs. Success in this market could add billions of dollars to Intel's revenue; according to Jon Peddie Research, discrete graphics card revenue will be $54 billion by 2025, up significantly from $23.6 billion in 2020.
Nvidia is currently the dominant player in this area with an 83% market share in the second quarter, while AMD holds the remainder. As it turns out, AMD is having a hard time withstanding the competitive pressure from Nvidia, and this could be an opportunity for Intel to do its part. If Intel starts taking GPU market share away from AMD and poaching potential Nvidia customers by producing enough cards and offering stable supply, it could gradually establish itself as a key player in the GPU market in the long run.
That could give Intel a much-needed boost, as the company's revenue will drop to $73.5 billion this year, compared with revenues of $77.9 billion in 2020. Analysts estimate that the downtrend could continue into 2022, but steady progress in the GPU market could give Intel a much-needed breather and help these tech stocks regain their spirit.

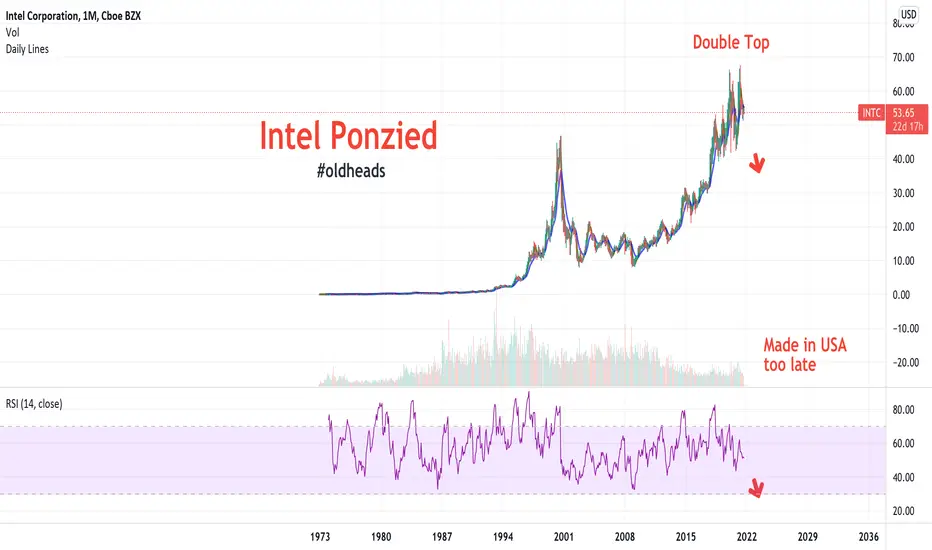
Intel Ponzied - Made in USA - Too LateOverseas profits. For sooooo long. Hmmmm. What now?
#holdforbroke
Stonks & Crypto Ponzi Pogs collapse.
What a shame.
Price Levels for INTCNASDAQ:INTC
The lines represent the price level that has been traded upon or will be traded.
The more it hit the line, the stronger the level.
It can be use to set profit taking price or stop loss price.
Every level is of same significant until order flow trades upon it.
DYODD.

Intel bounced off 200 MA and is ready to post some gainsNASDAQ:INTC bounced off the 200 MA and is setup for some gains. Anticipated price action and targets are shown on the chart, stop is daily close below 53$$.
Hit the like button please if you find this useful :)
This is only my own view and not a financial advice, do your own analysis before buying or selling
Happy Trading!

Intel Corp.Company Description:
Intel Corporation is one of the world's largest semiconductor chip maker. The Company develops advanced integrated digital technology products, primarily integrated circuits, for industries such as computing and communications. It also develops platforms, which it defines as integrated suites of digital computing technologies that are designed and configured to work together to provide an optimized user computing solution compared to components that are used separately. Intel designs and manufactures computing and communications components, such as microprocessors, chipsets, motherboards, and wireless and wired connectivity products, as well as platforms that incorporate these components. The Company sells its products primarily to original equipment manufacturers, original design manufacturers, PC and network communications products users, and other manufacturers of industrial and communications equipment. Intel Corporation is based in Santa Clara, California.
Analysis:
When taking a look at the 4 hour chart, I see a few indicators that give me bullish sentiment:
1. Candles near strong support.
2. RSI Oversold.
3. Mac D on it's down side.
4. High before the most recent previous high was broken.
5. 200/50 EMA Cross w/ 2 Orange Renkos.
Looking for a price target of $57 and up! Not Financial Advice. Always Do Research Before Decision!
8/30 INTC(1) support on pink line
(2) yellow line as short-term resistance, after break out, potential to fill the yellow gap above
(3) only a re-bounce play plan for me so far
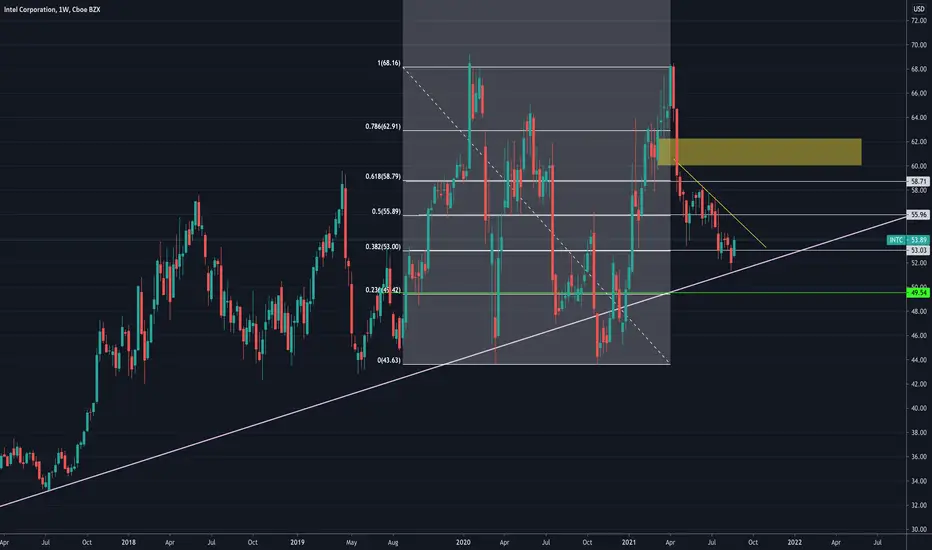
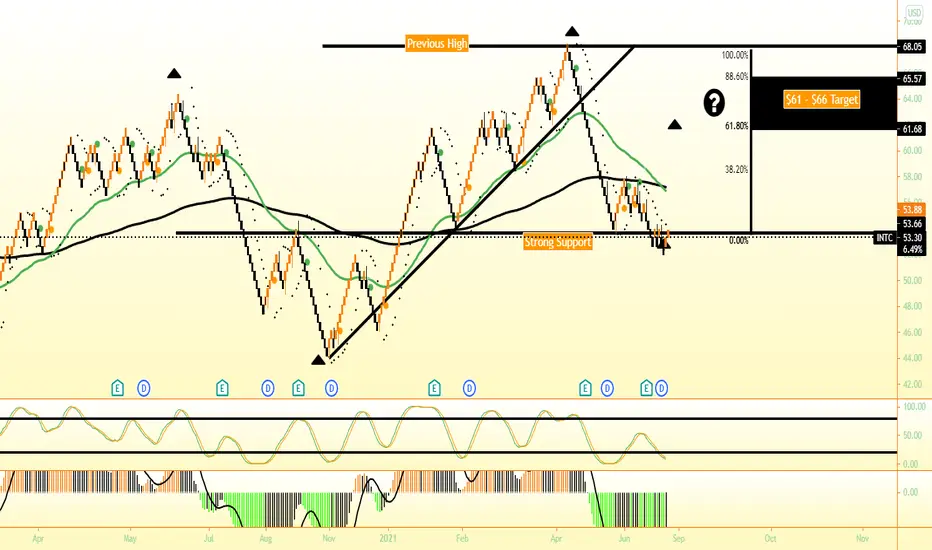
(INTC) Elliott Waves Potential
Elliott Wave idea, pending fifth wave, at .618, Volume profile, within 4 years range lows, ratio INTC/SOX potential Channel base, with RSI+.
BACA level specified.
