MTN - ShortJSE:MTN is looking good for a short. If triggered, we are aiming for a move down towards the R107 area.
LL6 trade ideas

MTN GroupMTN GROUP (MTN) - On Monday 24 October I discussed the share potentially trading lower and rebounding off the trend line (lower boundary). Subsequently, we saw a sell-off on the same day, followed by a strong reversal in the following session, with continued upside through to Friday and a six-week high of 13881c. Potential upside resistance is the channel trend line which is in line with the 61,8% FIB retracement (14193c). Dip-buyers would look to 12600c to 12800c as potential re-accumulation zones.

MTN JSE:MTN is at an area of value. Given the tough market conditions I won't be surprised if it moves lower.

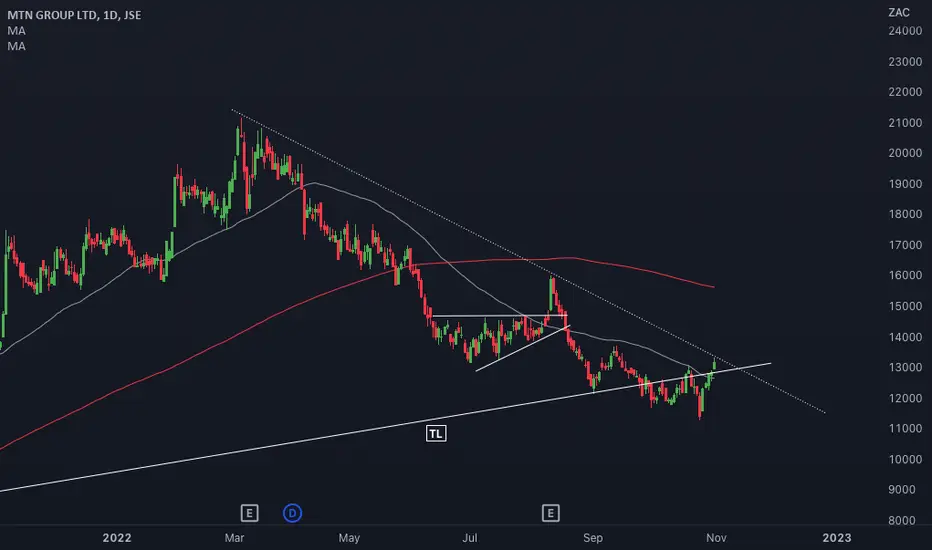
$JSEMTN - MTN Group: Buy The DipA simple analysis of MTN following a 47% dip from the 52 week high.
MACD/price convergence signals the selling momentum is waning.
The resistance trendline has not yet been broken convincingly.
Use R112,62 as stop-loss level.

MTN looking for a push higherMTN has managed to reclaim long term support (TL) but is now facing a little resistance at R133.50 - downward TL. A close above R137.59 would probably see it make a move higher towards its 200DMA. We wait for confirmation of a breakout before entering a long.
MTNLoss of neckline support on MTN could target 85 next. It's a technical Head & Shoulder pattern in play.

MTN also showing a crash Inv C&H formed over the last couple of months.
Broke below brim - R135.00
Target 1 R70.10

MTN long term bearish viewMTN monthly candlesticks have printed out a nice break and pullback to the previous support level that has become resistance and has reacted accordingly with some bearish momentum over the past few months, I therefore expect a longer term bearish view on MTN stocks to somewhere 2682 ZAC.

MTN - Approaches Minor SupportMTN has had a torrid August and is approaching a 'minor' support were the downward pressure could ease. Only a daily close above the previous day high will signal an indication of the bulls attempting to fight back.
Oscillators are in oversold territory .
-- MANAGE YOUR RISK - -
Disclaimer: All ideas are my opinion and should not be taken as financial advice.

MTN - "Mayday Mayday"Something brewing on this stock...13 sessions straight down on this market darling . I'm sure it will be made known to the market soon 🧐
JSE:MTN

MTN, not looking goodJSE:MTN weekly close will be interesting. The stock has been on a downtrend for a while now. It opened the week, weak, and a close below R130/share can see it test R122, or worse, R108. Tread carefully.

MTN at an area of valueJSE:MTN is back at an area of value. The stock attempted to rally following the proposed JSE:TKG takeover, both stocks enjoyed a mini-rally. The rally ran out of steam last week, and now JSE:MTN is back at the support level. A catalyst is needed here to push the stock up, otherwise a potential breakdown may play out. No position.

MTN pullback after box break upMTN could offer a good long if today ends green back above the R145 level

MTN - Big DAY!Now that's the candle i want for my birthday 🤪
Massive day yesterday for MTN off the back of earnings, 200 day likely next target
-- MANAGE YOUR RISK - -
Disclaimer: All ideas are my opinion and should not be taken as financial advice.
If you would like me to have a look at any chart, direct message and i will post my thoughts, Happy Trading!

MTN Breakthrough and RetestLiking MTN here for a long, broke through the resistance and came back to retest.
Hopefully market turmoil doesn't get in the way.
What do you think about this setup?

MTN LongThe share has just broken above the 50-day moving average and this opens it to a move towards R156.92 first and then the 200-day moving average level of R165.18.

MTNMTN Group (MTN) – I discussed on the share on 18 March at 19714c, highlighting the potential for a sideways consolidation. I also recently flagged a long trade from 15932c (entry) to 16950c (target). We have since seen a sharp decline to R140, coinciding with the general market weakness. How I’m seeing it now: (1) price extended to the downside vs it’s quarterly pivot. This range of extension often sees a reversion to the mean (see my April Shoprite short idea at R245 as an example). (2) the share is trading at 2.5 to 3x it’s mean of it’s 200-day linear regression channel. I’m looking for the share to start building a near-term around currently levels. Note: this may not be the exact short term bottom however on a medium term basis, the share is starting to trade in ‘near oversold’ territory.

MTNMTN Group – How I’m Seeing It:
I discussed on the share on 18 March at 19714c, highlighting the potential for a sideways consolidation. I also recently flagged a long trade from 15932c (entry) to 16950c (target). We have since seen a sharp decline to R140, coinciding with the general market weakness. How I’m seeing it now: (1) price extended to the downside vs it’s quarterly pivot. This range of extension often sees a reversion to the mean (see my April Shoprite short idea at R245 as an example). (2) the share is trading at 2.5 to 3x it’s mean of it’s 200-day linear regression channel. I’m looking for the share to start building a near-term around currently levels or slightly lower. Note: this may not be the exact short term bottom however on a medium term basis, the share is starting to trade in ‘near oversold’ territory.

MTN - Next level to watchMTN is in a steady downtrend currently on the daily from its swing high of R207.66...
The next area of interest that i will be watching closely is R136-137.50 where a breakout gap exists.
Price action will be key there to see if any kind of pullback/reversion in this down leg could possibly unfold.
-- MANAGE YOUR RISK - -
Disclaimer: All ideas are my opinion and should not be taken as financial advice.

MTNMTN making a series of low-highs, and developing a bearish descending triangle chart pattern in the process.
If confirmed this may take price to around R110, albeit with some support levels to overcome along the way.
*That down trendline line (currently around 170-175) has to be broken for the uptrend to remain intact and resume.

@VillageTRaderZA - Not saying it's topped but it looks toppishThere's a worrisome bearish divergence on the weekly chart and a potential head and shoulders pattern on the daily chart with MTN. The neckline hovering over the 200 day EMA. If that fails to hold it would confirm the H&S pattern for a short with a target looming around the R120.

AG Capital -Storm trading Morning Call 6 May 2022We give a quick recap of markets overnight and the previous day and insights into the day ahead with a few trade ideas on the day. Ideas are strictly NOT INVESTMENT ADVICE.

AG Capital -Storm trading Morning Call 14 April 2022
We give a quick recap of markets overnight and the previous day and insights into the day ahead with a few trade ideas on the day. Ideas are strictly NOT INVESTMENT ADVICE.
